Cincinnati Heatmap
Ever since I learned how to make heatmaps with QGIS, I’ve been wanting to put one together tracking everywhere I go within a city I’m visiting on a given trip. I haven’t had much opportunity, though—with the COVID-19 pandemic, my travel has been extremely limited. The few trips I have had were to suburban locations where I was driving everywhere, which aren’t as great for a heatmap since they’re too spread out, and I wouldn’t want to publicly share that level of positional detail about a work trip anyway.
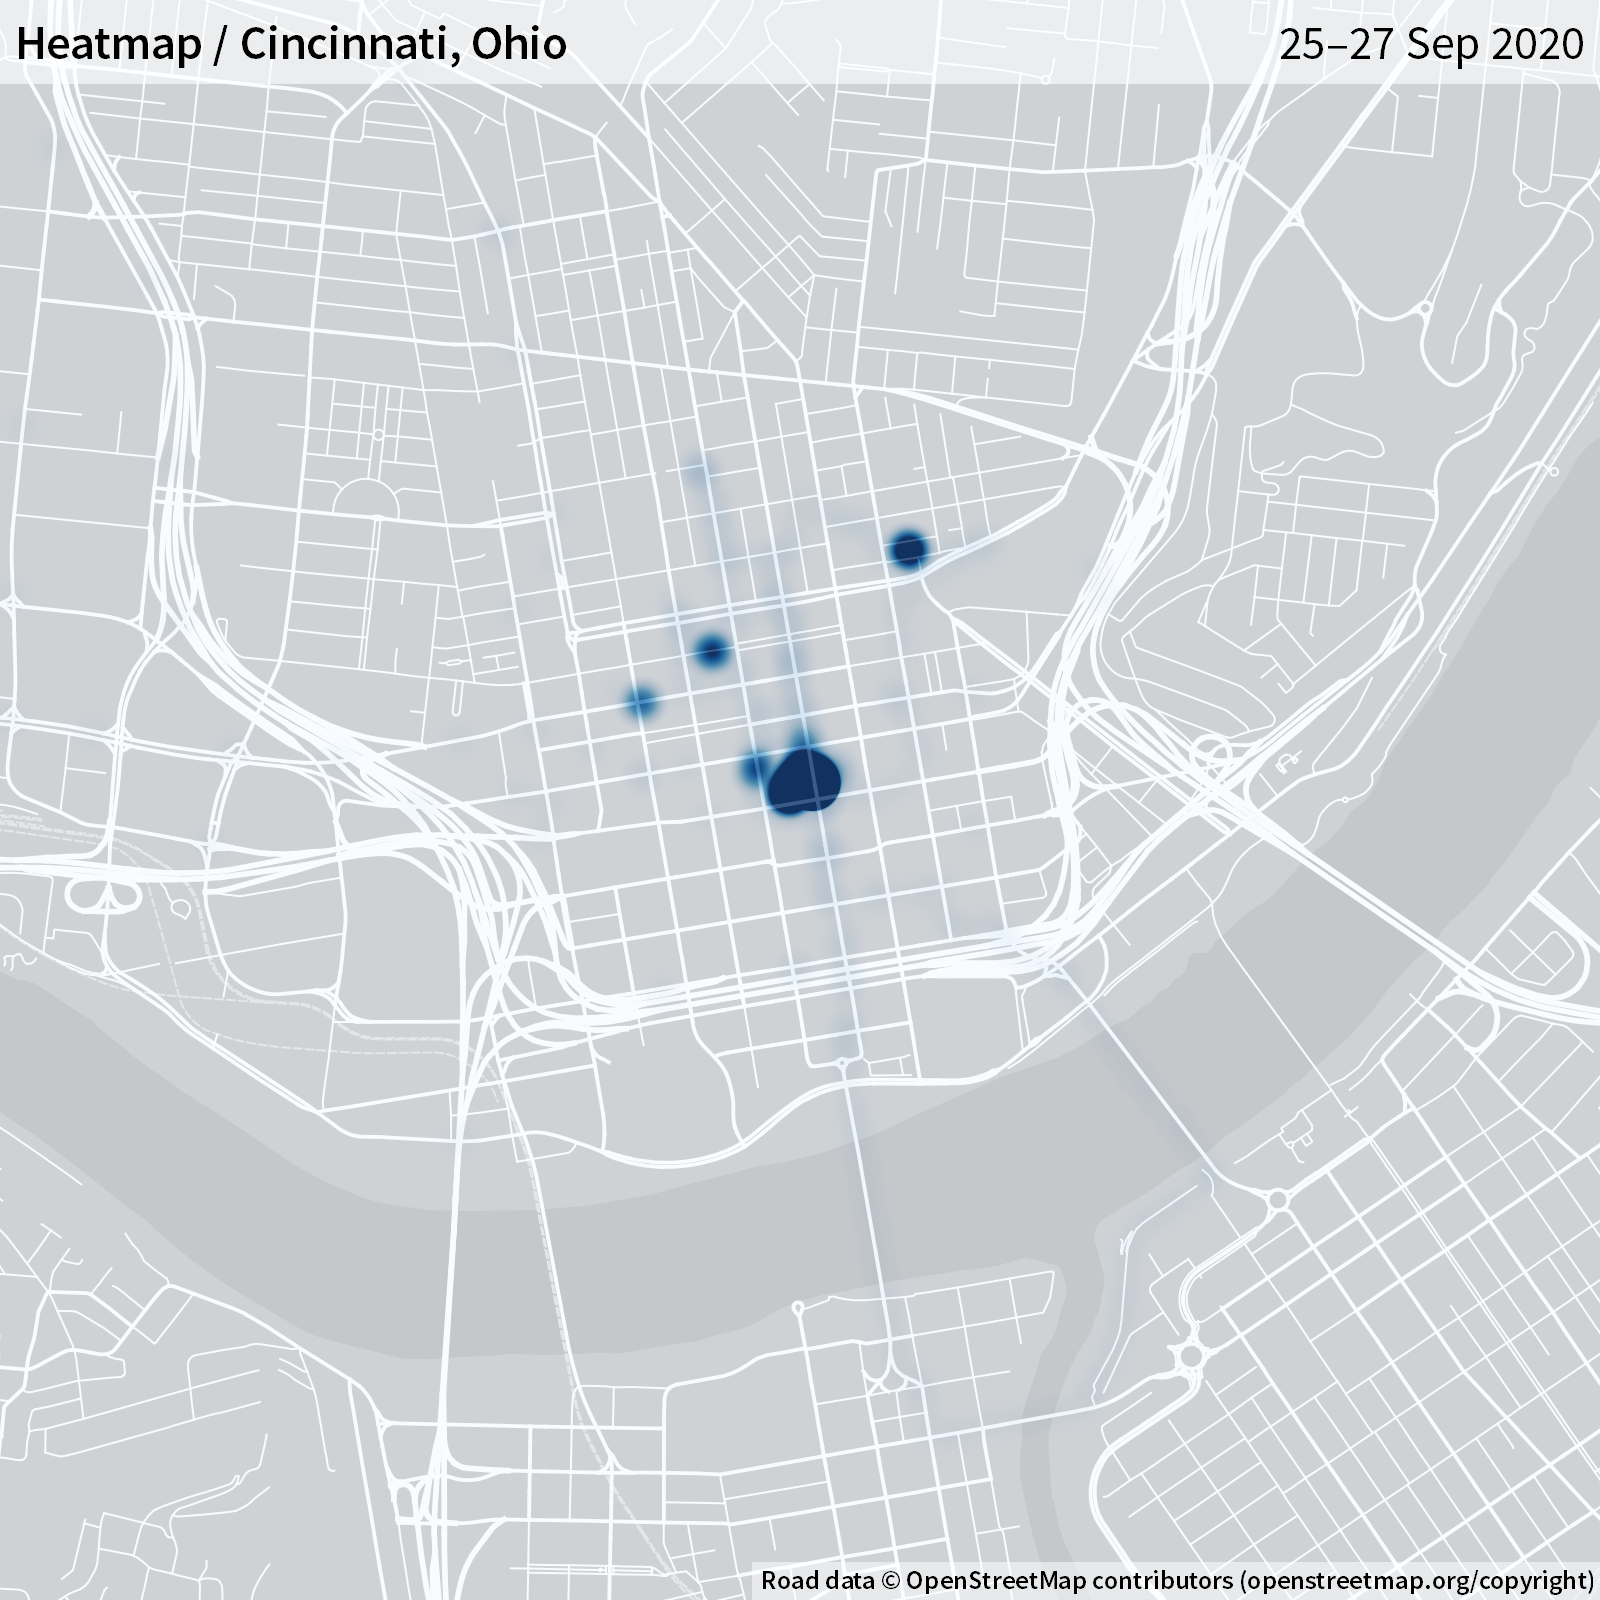
This past weekend, though, I had the opportunity to do a heatmap trial run—I decided to take Friday off, and we booked a hotel just down the road in Cincinnati for a little staycation. This certainly isn’t the most interesting map since COVID precautions meant we largely stayed in the hotel except to go on walks or wait for carryout food, but it’s a good proof of concept.
I used a GPS app to log my location every 60 seconds, which I chose as a tradeoff between getting enough data to generate the heatmap, and not creating too large of a dataset or too much battery drain when running a log over several days. This choice ended up being largely fine, but if I was walking in a straight line on the map the data wasn’t quite dense enough—I could see a trail of distinct heat spots rather than a continuous line. Fortunately, it’s hard to see on lightly traveled routes, and not an issue with heavily traveled routes, but next time I’ll probably set it to sample my location every 30 seconds.