I’ve visited every county in Ohio, so I’ve seen a lot of the state—but there are still a lot of nearby towns I haven’t been to.
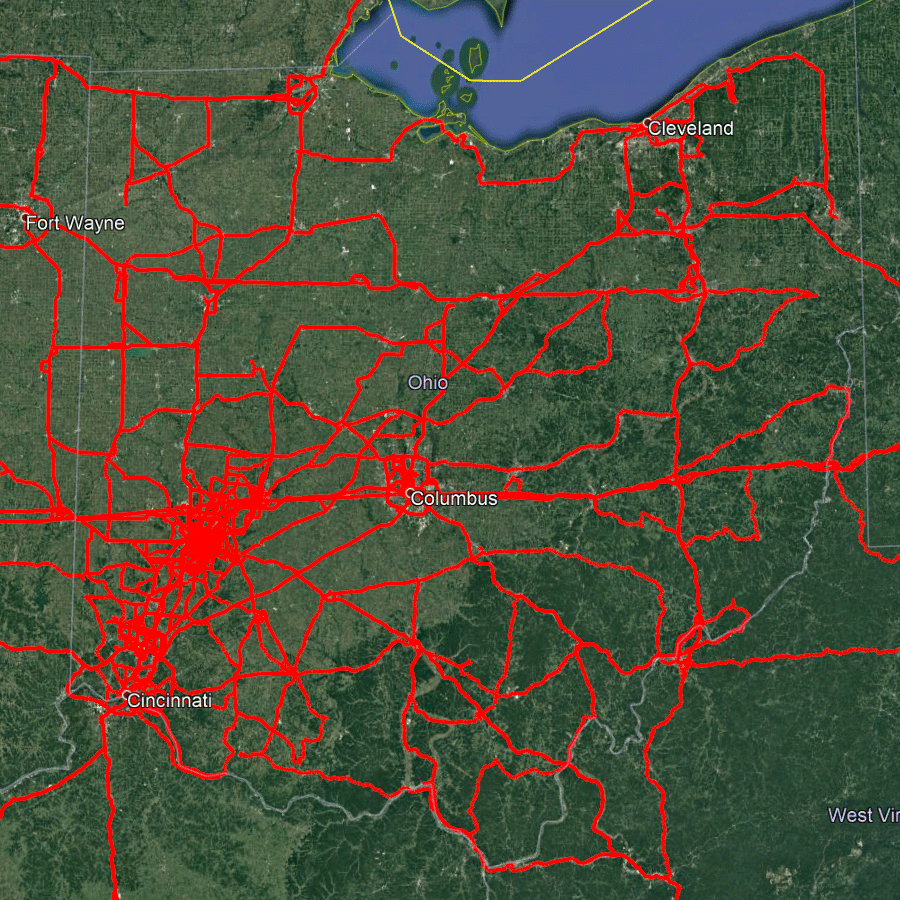
My driving in Ohio from summer 2010 through January 2021. While a lot of the state is covered, there are still plenty of towns in the gaps.
Satellite imagery from Google Earth
A lot of those towns are small enough that there’d be no reason to take a long drive to visit them specifically, but if they were close enough, it might be worth swinging through. The larger a town was, the further I’d be willing to drive to visit it.
I started thinking about this relationship between population and distance, and whether there was a way to quantify which towns I should be most willing to visit. And then I realized that a force that got stronger as objects got bigger and distances got smaller sounded a lot like gravity:
F is the gravitational force between two objects, G is a constant, m1 and m2 are the masses of two objects, and r is the distance between them. If I treated cities like objects where their populations were their mass, then the “force” between my home city and another town would be proportional to the product of their populations divided by the square of the distance between them. (I wasn’t the only person to have this idea.)
Since we don’t need the gravitational constant for a ratio,1 we end up with the following formula:
N1 and N2 are the number of people in (population of) my hometown of Beavercreek, Ohio, and the town I’m comparing it to; d is the distance between them. So my willingness to drive to a town should be proportional to the product of Beavercreek’s and that town’s population, divided by the square of their distance.
Since distance is squared, this basically means that a town would need to have four times the population for me to drive twice as far—or 100 times the population to drive ten times as far. So the highest force cities will mostly be pretty close to home, but a few further cities with large populations could potentially overcome their distance disadvantage.
Table of Contents
Gravitational Force for Each Town
To calculate the gravitational force for every town in the United States, I needed each town’s location (latitude and longitude) and population. Fortunately, I was able to find that as a spreadsheet from the Simplemaps United States Cities Database (November 18, 2020 edition). I used the Basic (free) data, as I was fine limiting myself to only census-recognized incorporated towns.
One caveat to note is that this data uses the metro population for cities (so for larger cities, both the city proper and its suburbs are counted in the population). This does mean that suburbs are double counted—once as their own population, and once under the metro area they belong to. For what I was doing, this was fine; the draw (“force”) of a larger city really is its whole metro area population, and it would also be interesting to see if any individual suburbs were themselves large enough to exert a significant force.
This was the most obvious for Dayton, which Beavercreek is a suburb of. Dayton was both very close and included the population of everything nearby (including Beavercreek), so it became by far the most forceful city in my list.
I wrote a quick Python script which would read the location/population spreadsheet, calculate the distance from Beavercreek to every town based on their coordinates, calculate the gravitational force between Beavercreek and each town based on the population and distance, and save the whole thing to a CSV spreadsheet.
100 Highest Gravity Cities
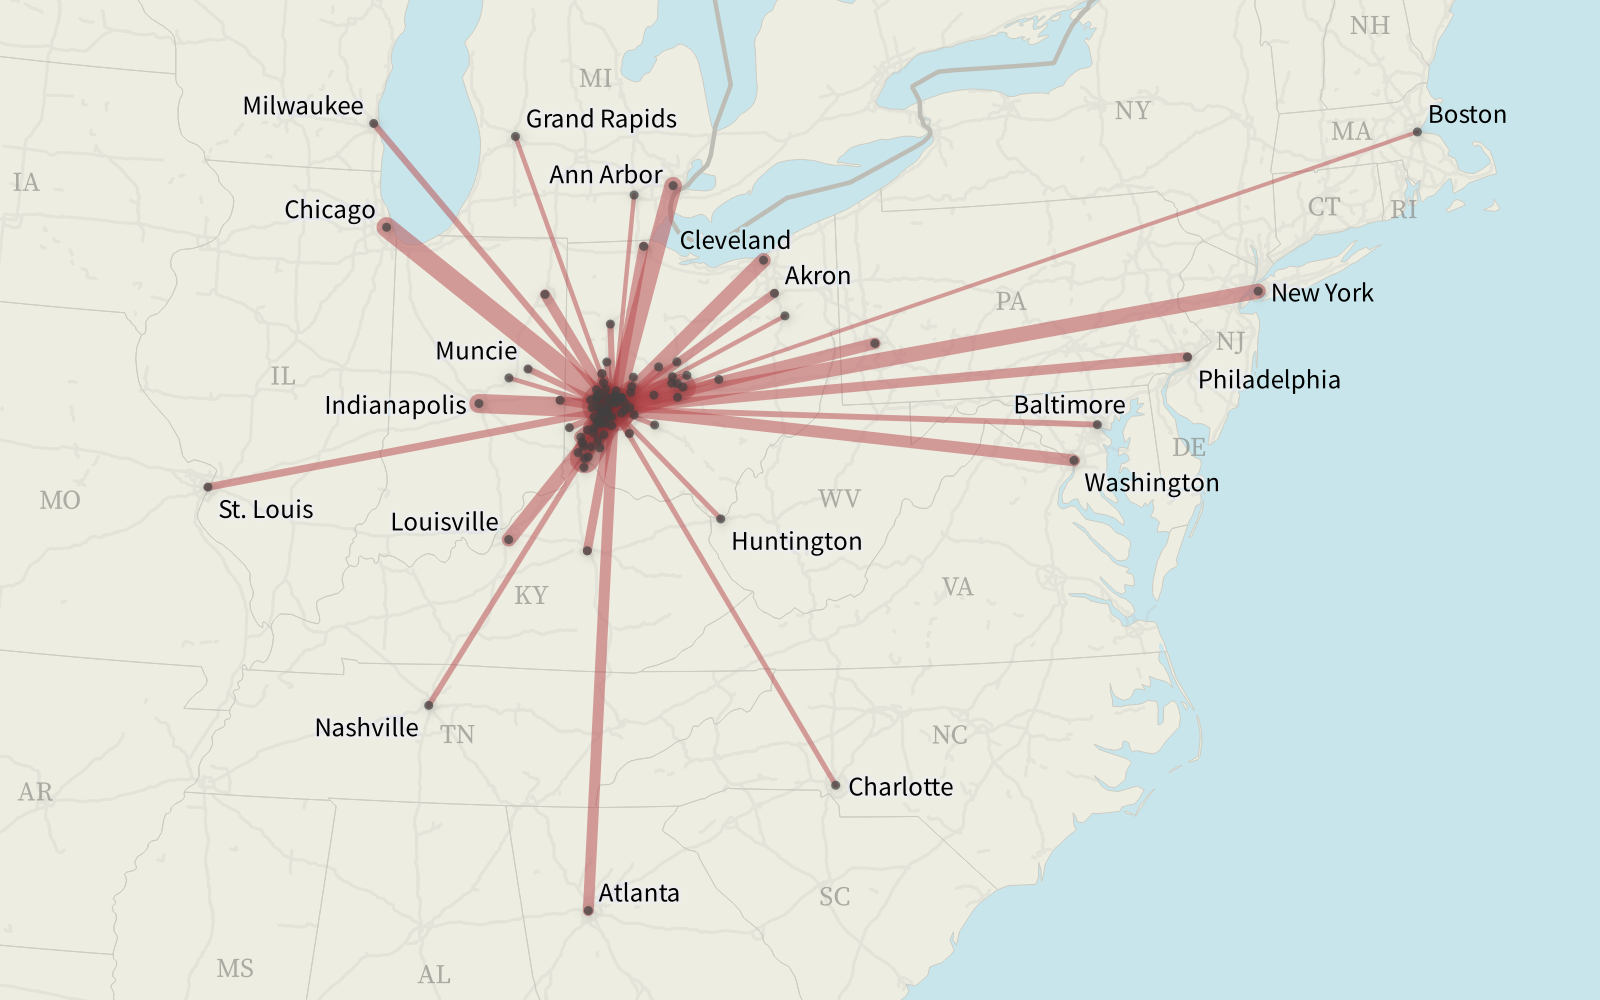
The one hundred cities with the highest gravitational force on Beavercreek, Ohio. Each black dot is a top 100 city, and thicker lines indicate higher gravitational forces. To avoid clutter, many low-distance cities do not have name labels.
The hundred U.S. cities with the highest demographic gravitational force on Beavercreek, Ohio, are as follows:
| Rank | City | Metro Population | Distance (mi) | Distance (km) | Gravitational Force |
|---|---|---|---|---|---|
| 1 | Dayton OH | 718 353 | 8.0 | 12.9 | 530 974 391 |
| 2 | Kettering OH | 54 855 | 5.2 | 8.4 | 95 648 149 |
| 3 | Riverside OH | 25 133 | 4.8 | 7.8 | 51 726 576 |
| 4 | Fairborn OH | 33 876 | 5.6 | 9.0 | 51 595 630 |
| 5 | Cincinnati OH | 1 662 691 | 47.1 | 75.8 | 35 744 828 |
| 6 | Xenia OH | 26 947 | 7.2 | 11.7 | 24 523 667 |
| 7 | Huber Heights OH | 38 154 | 9.3 | 14.9 | 21 169 639 |
| 8 | Columbus OH | 1 562 009 | 59.8 | 96.2 | 20 852 257 |
| 9 | Centerville OH | 23 703 | 8.0 | 12.9 | 17 611 227 |
| 10 | Oakwood OH | 8 936 | 5.9 | 9.6 | 12 089 522 |
| 11 | Springfield OH | 82 820 | 19.7 | 31.7 | 10 171 252 |
| 12 | Middletown OH | 97 730 | 22.6 | 36.3 | 9 169 352 |
| 13 | Bellbrook OH | 7 344 | 6.5 | 10.5 | 8 239 946 |
| 14 | Chicago IL | 8 604 203 | 239.0 | 384.6 | 7 193 596 |
| 15 | Indianapolis IN | 1 588 961 | 110.7 | 178.2 | 6 189 038 |
| 16 | Trotwood OH | 24 403 | 14.2 | 22.8 | 5 815 977 |
| 17 | Miamisburg OH | 20 143 | 13.1 | 21.1 | 5 613 201 |
| 18 | West Carrollton OH | 12 864 | 11.0 | 17.8 | 5 047 767 |
| 19 | Vandalia OH | 14 997 | 12.4 | 19.9 | 4 691 127 |
| 20 | Detroit MI | 3 506 126 | 190.0 | 305.7 | 4 638 581 |
| 21 | Springboro OH | 18 931 | 14.9 | 24.0 | 4 075 382 |
| 22 | Wright-Patterson AFB OH | 2 579 | 5.5 | 8.9 | 4 000 226 |
| 23 | Moraine OH | 6 470 | 10.0 | 16.1 | 3 081 966 |
| 24 | New York NY | 18 713 220 | 538.7 | 867.0 | 3 078 485 |
| 25 | Cleveland OH | 1 710 093 | 173.7 | 279.5 | 2 707 216 |
| 26 | Louisville KY | 1 005 654 | 137.7 | 221.5 | 2 533 525 |
| 27 | Englewood OH | 13 435 | 15.9 | 25.6 | 2 528 263 |
| 28 | Hamilton OH | 62 082 | 35.5 | 57.1 | 2 351 560 |
| 29 | Troy OH | 26 281 | 23.1 | 37.2 | 2 342 943 |
| 30 | Clayton OH | 13 222 | 17.1 | 27.5 | 2 166 482 |
| 31 | Mason OH | 33 870 | 28.8 | 46.4 | 1 946 363 |
| 32 | Lebanon OH | 20 659 | 22.6 | 36.4 | 1 928 342 |
| 33 | Franklin OH | 11 612 | 17.4 | 28.0 | 1 829 293 |
| 34 | Washington DC | 5 379 184 | 380.8 | 612.9 | 1 770 627 |
| 35 | Yellow Springs OH | 3 852 | 10.3 | 16.5 | 1 748 634 |
| 36 | Pittsburgh PA | 1 703 266 | 221.5 | 356.4 | 1 657 952 |
| 37 | Park Layne OH | 4 082 | 10.9 | 17.6 | 1 633 354 |
| 38 | Tipp City OH | 10 115 | 17.4 | 28.0 | 1 595 377 |
| 39 | Atlanta GA | 5 449 398 | 412.9 | 664.4 | 1 526 351 |
| 40 | Fairfield OH | 42 558 | 37.6 | 60.6 | 1 433 355 |
| 41 | Fort Wayne IN | 334 122 | 109.7 | 176.5 | 1 325 493 |
| 42 | Toledo OH | 482 111 | 135.9 | 218.7 | 1 246 265 |
| 43 | Wilberforce OH | 2 291 | 9.5 | 15.3 | 1 211 433 |
| 44 | Philadelphia PA | 5 649 300 | 473.7 | 762.3 | 1 202 115 |
| 45 | New Carlisle OH | 5 568 | 14.9 | 24.0 | 1 199 556 |
| 46 | Cedarville OH | 4 343 | 13.4 | 21.6 | 1 153 243 |
| 47 | Piqua OH | 21 936 | 30.5 | 49.2 | 1 122 739 |
| 48 | Union OH | 6 891 | 17.2 | 27.7 | 1 109 078 |
| 49 | Lexington KY | 317 110 | 118.6 | 190.9 | 1 076 145 |
| 50 | Monroe OH | 14 015 | 25.5 | 41.0 | 1 029 615 |
| 51 | Richmond IN | 42 373 | 44.5 | 71.6 | 1 020 718 |
| 52 | Akron OH | 565 208 | 162.9 | 262.2 | 1 016 444 |
| 53 | Wilmington OH | 12 222 | 24.0 | 38.6 | 1 011 793 |
| 54 | Green Meadows OH | 2 366 | 11.3 | 18.1 | 888 485 |
| 55 | Carlisle OH | 5 446 | 17.2 | 27.7 | 879 091 |
| 56 | Germantown OH | 5 519 | 17.4 | 28.1 | 865 397 |
| 57 | Enon OH | 2 386 | 11.5 | 18.5 | 857 544 |
| 58 | St. Louis MO | 2 024 074 | 339.6 | 546.5 | 837 974 |
| 59 | Trenton OH | 13 141 | 27.5 | 44.2 | 830 748 |
| 60 | Waynesville OH | 3 181 | 13.8 | 22.2 | 801 186 |
| 61 | Dublin OH | 49 037 | 55.2 | 88.9 | 767 271 |
| 62 | Oxford OH | 23 113 | 39.4 | 63.5 | 709 538 |
| 63 | Grove City OH | 41 820 | 53.5 | 86.1 | 696 748 |
| 64 | Muncie IN | 87 879 | 77.6 | 124.9 | 696 344 |
| 65 | Milwaukee WI | 1 365 787 | 306.5 | 493.3 | 693 991 |
| 66 | Brookville OH | 5 874 | 20.3 | 32.7 | 681 213 |
| 67 | Lima OH | 68 878 | 69.8 | 112.4 | 674 285 |
| 68 | Sidney OH | 21 148 | 39.0 | 62.7 | 665 358 |
| 69 | Holiday Valley OH | 1 390 | 10.0 | 16.1 | 662 500 |
| 70 | Covington KY | 40 341 | 54.0 | 86.8 | 661 477 |
| 71 | Hilliard OH | 36 534 | 52.4 | 84.3 | 636 028 |
| 72 | Baltimore MD | 2 106 068 | 398.0 | 640.4 | 634 889 |
| 73 | Drexel OH | 1 991 | 12.3 | 19.7 | 631 556 |
| 74 | Nashville TN | 1 081 903 | 287.2 | 462.1 | 626 411 |
| 75 | New Lebanon OH | 4 067 | 17.7 | 28.4 | 622 761 |
| 76 | Northridge OH | 7 343 | 23.8 | 38.3 | 618 135 |
| 77 | Jamestown OH | 4 038 | 17.7 | 28.5 | 614 811 |
| 78 | Crystal Lakes OH | 1 467 | 10.9 | 17.6 | 588 776 |
| 79 | London OH | 14 870 | 35.0 | 56.3 | 579 125 |
| 80 | Forest Park OH | 18 583 | 39.4 | 63.5 | 570 379 |
| 81 | Urbana OH | 11 313 | 30.8 | 49.5 | 570 301 |
| 82 | Charlotte NC | 1 512 923 | 359.2 | 578.1 | 559 795 |
| 83 | Huntington WV | 186 034 | 126.3 | 203.2 | 557 026 |
| 84 | Washington Court House OH | 15 059 | 36.3 | 58.4 | 545 824 |
| 85 | Loveland OH | 13 145 | 33.9 | 54.6 | 545 698 |
| 86 | Upper Arlington OH | 35 366 | 56.4 | 90.8 | 530 055 |
| 87 | West Milton OH | 4 828 | 21.0 | 33.9 | 520 398 |
| 88 | Grand Rapids MI | 609 314 | 238.0 | 383.1 | 513 357 |
| 89 | Anderson IN | 85 992 | 89.7 | 144.4 | 510 215 |
| 90 | Sharonville OH | 13 684 | 36.0 | 58.0 | 503 327 |
| 91 | Canton OH | 269 418 | 160.3 | 258.1 | 500 271 |
| 92 | Ann Arbor MI | 322 267 | 176.7 | 284.3 | 493 016 |
| 93 | Newark OH | 80 451 | 89.9 | 144.7 | 475 245 |
| 94 | Norwood OH | 19 776 | 44.6 | 71.8 | 474 626 |
| 95 | Delaware OH | 41 283 | 64.9 | 104.4 | 468 612 |
| 96 | Marysville OH | 24 949 | 50.6 | 81.5 | 464 698 |
| 97 | Boston MA | 4 688 346 | 698.9 | 1 124.8 | 458 198 |
| 98 | Five Points OH | 1 723 | 13.6 | 21.8 | 446 704 |
| 99 | Westerville OH | 41 103 | 66.3 | 106.7 | 446 414 |
| 100 | White Oak OH | 19 900 | 46.2 | 74.3 | 445 241 |
Though the majority of the high-gravity cities are close to Beavercreek, the forces of the high populations of Chicago (#14) and New York (#24) more than make up for their distances. But although Los Angeles has a higher population than Chicago, L.A. only ranks #202—the distance is just too great for it to have much effect.
25 Lowest Gravity Cities
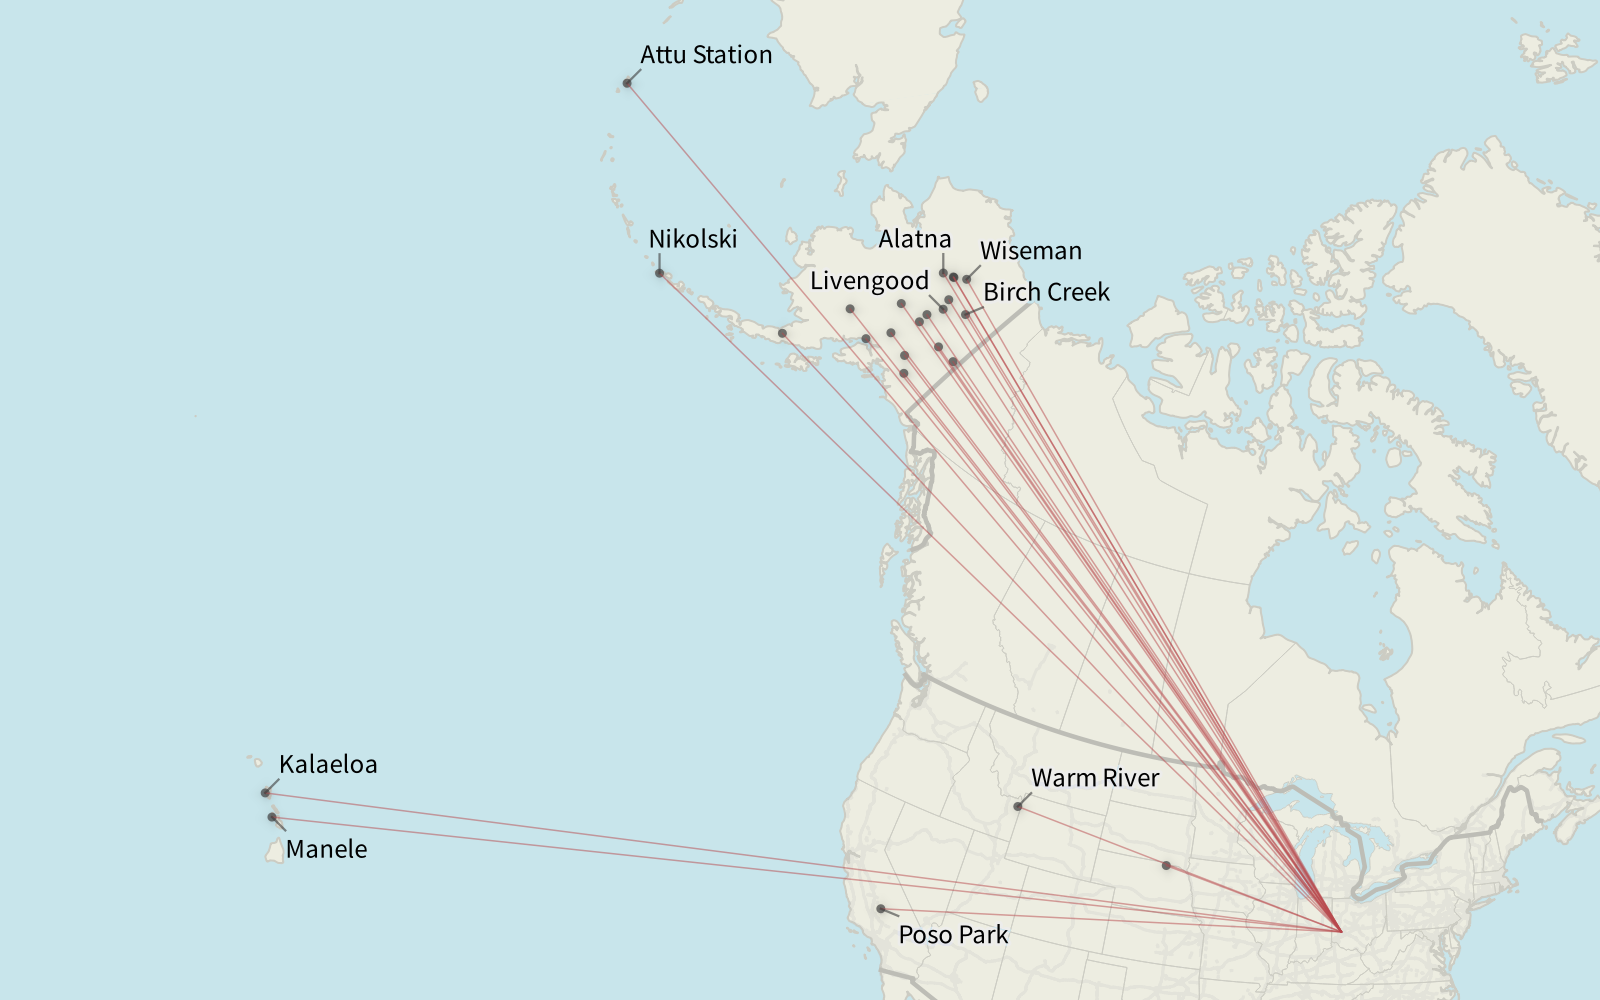
The twenty-five U.S. cities with the lowest gravitational force on Beavercreek, Ohio.
The twenty-five U.S. cities with the lowest attraction to Beavercreek are tiny faraway towns, mostly in Alaska:
| Rank | City | Metro Population | Distance (mi) | Distance (km) | Gravitational Force |
|---|---|---|---|---|---|
| 28347 | Ferry AK | 16 | 3 049.3 | 4 907.4 | 0.082 |
| 28348 | Nikolski AK | 26 | 3 897.0 | 6 271.5 | 0.082 |
| 28349 | Monowi NE | 1 | 770.0 | 1 239.3 | 0.081 |
| 28350 | Chicken AK | 13 | 2 836.0 | 4 564.2 | 0.077 |
| 28351 | Warm River ID | 3 | 1 426.7 | 2 296.0 | 0.070 |
| 28352 | Lake Minchumina AK | 14 | 3 153.5 | 5 075.0 | 0.067 |
| 28353 | Wiseman AK | 13 | 3 093.3 | 4 978.1 | 0.065 |
| 28354 | Manele HI | 24 | 4 421.0 | 7 115.0 | 0.059 |
| 28355 | Bettles AK | 12 | 3 129.2 | 5 036.0 | 0.059 |
| 28356 | Stevens Village AK | 11 | 3 059.0 | 4 923.0 | 0.056 |
| 28357 | Evansville AK | 11 | 3 126.1 | 5 030.9 | 0.054 |
| 28358 | Kenny Lake AK | 9 | 2 916.6 | 4 693.8 | 0.051 |
| 28359 | Lake Louise AK | 9 | 2 973.1 | 4 784.7 | 0.049 |
| 28360 | Chase AK | 9 | 3 081.2 | 4 958.6 | 0.045 |
| 28361 | Attu Station AK | 17 | 4 559.6 | 7 337.9 | 0.039 |
| 28362 | Lime Village AK | 8 | 3 261.5 | 5 248.9 | 0.036 |
| 28363 | Ugashik AK | 8 | 3 366.6 | 5 418.0 | 0.034 |
| 28364 | Kalaeloa HI | 14 | 4 460.3 | 7 178.1 | 0.034 |
| 28365 | Poso Park CA | 2 | 1 895.7 | 3 050.8 | 0.027 |
| 28366 | Healy Lake AK | 4 | 2 919.8 | 4 699.0 | 0.022 |
| 28367 | Livengood AK | 4 | 3 038.2 | 4 889.5 | 0.021 |
| 28368 | Four Mile Road AK | 4 | 3 056.3 | 4 918.6 | 0.020 |
| 28369 | Beluga AK | 4 | 3 125.0 | 5 029.3 | 0.020 |
| 28370 | Alatna AK | 4 | 3 164.4 | 5 092.6 | 0.019 |
| 28371 | Birch Creek AK | 2 | 2 971.0 | 4 781.3 | 0.011 |
Of course, I wouldn’t be able to drive to the Hawaiian (or many of the Alaskan) cities anyway.
Analysis
One thing that stood out to me was the enormous difference in gravitational force between the top and bottom U.S. city:
| Rank | City | Gravitational Force |
|---|---|---|
| 1 | Dayton OH | 5.3 × 10+8 |
| 28371 | Birch Creek AK | 1.1 × 10⁻² |
So Dayton exerts ten orders of magnitude more gravitational force than Birch Creek—the force is about forty-eight billion times stronger!
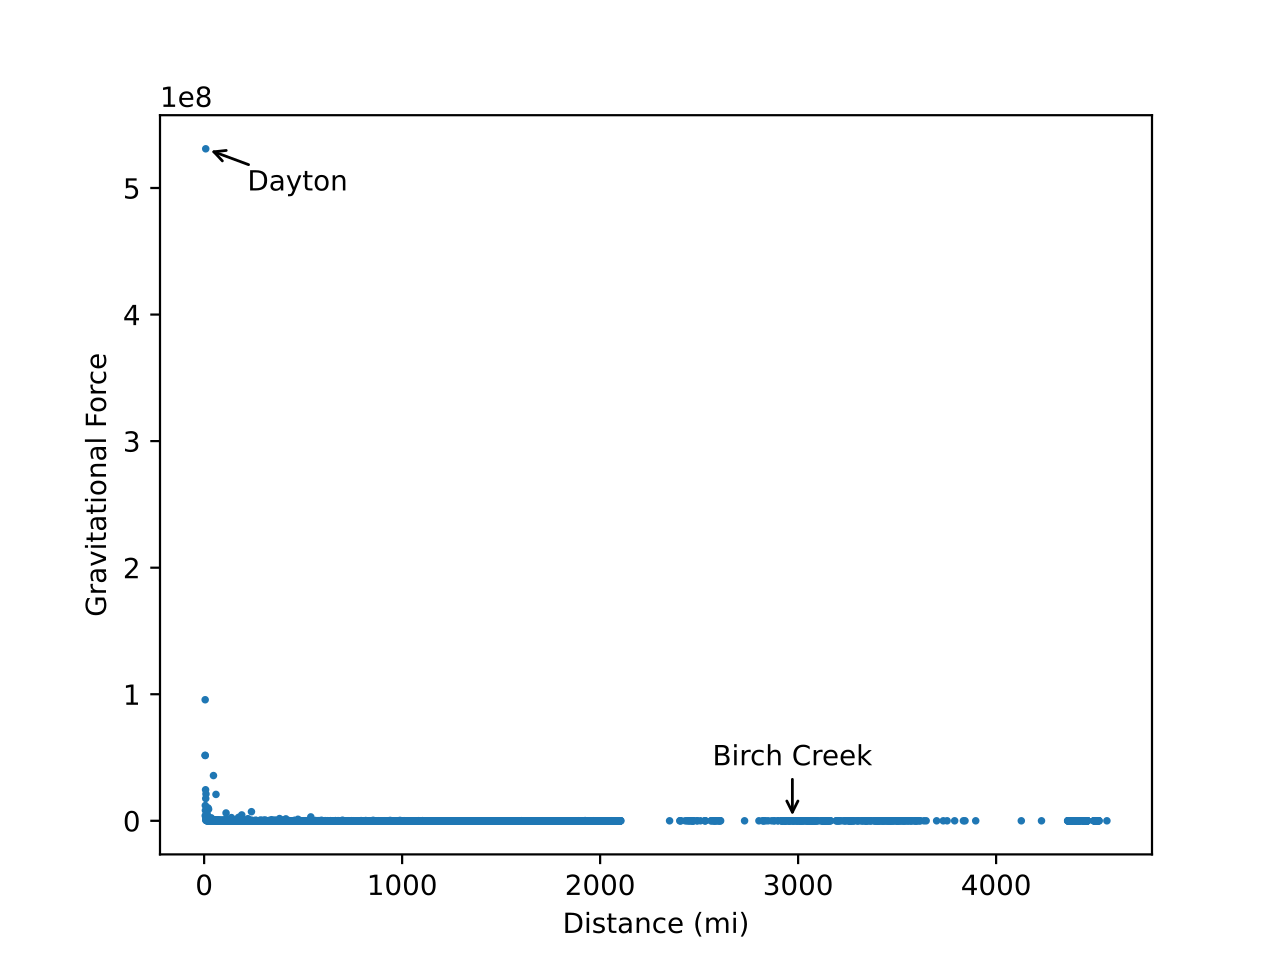
It’s striking how strong Dayton’s force is compared to every other city.
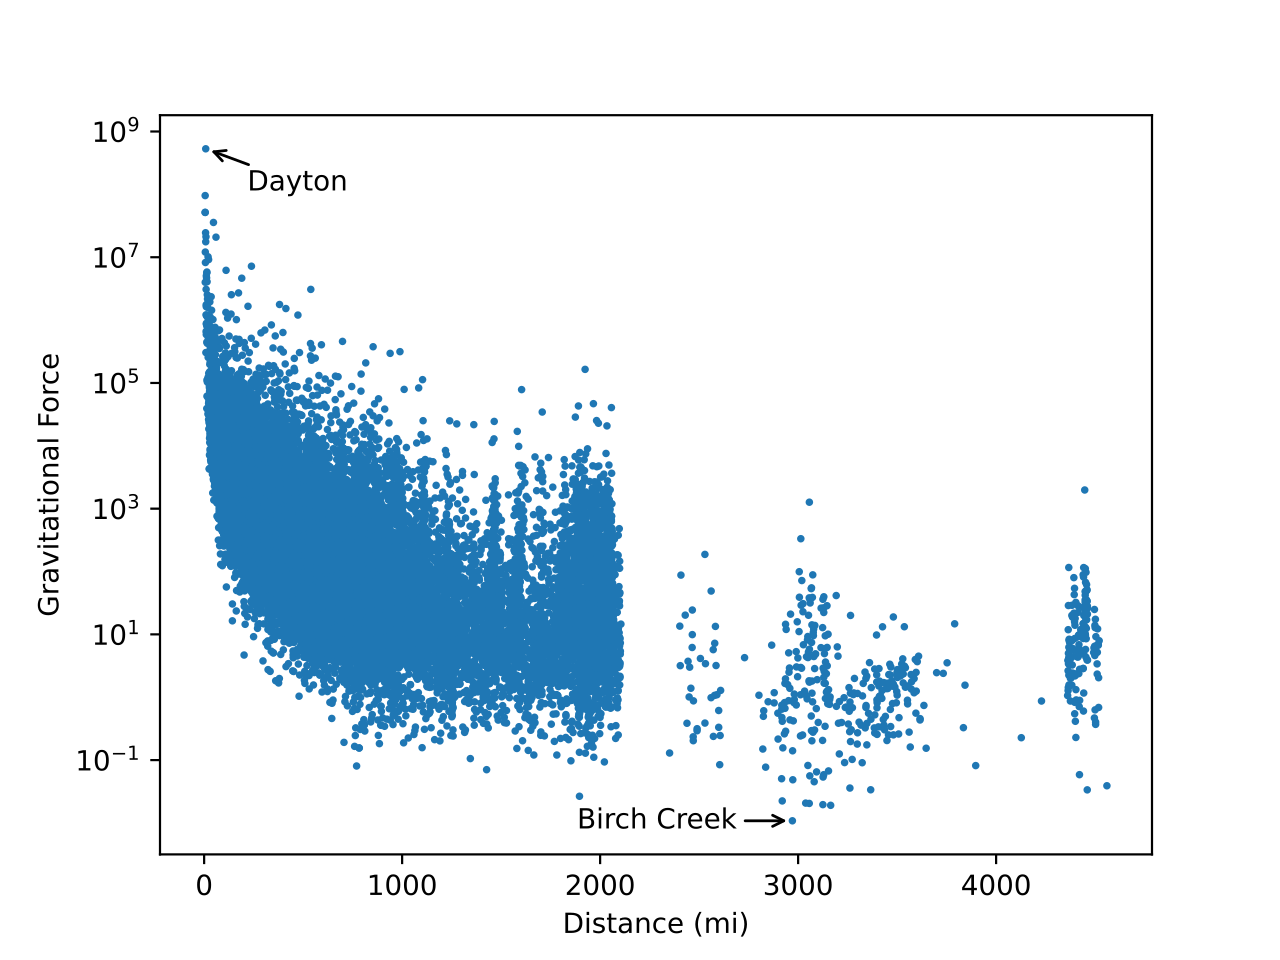
Even with gravitational force on a logarithmic scale, Dayton stands out.
If the earth’s current population (7.839 billion as of 14 January 2021) moved to a single city, how far away would it have to be to exert the same force on Beavercreek as Dayton?
839 miles (1350 km), as it turns out. That’s just slightly less than the distance from Beavercreek to Dallas, TX (853 mi or 1373 km)—so if the earth’s entire population moved to Dallas, it would still have less gravitational force on Beavercreek than Dayton does now!

Conclusion
Although demographic gravitational force seems pretty arbitrary, the list of cities with highest force actually lines up pretty well with where I go the most often. I spend most of my time in the towns immediately near where I live, but I tend to visit larger cities a few hours’ drive away (Chicago, Indianapolis) more often than I visit some of the smaller towns a few dozen miles from me.
-
Technically we don’t need the population of my hometown either, since if we’re comparing everything to my hometown its population will be a constant, but to make this formula more applicable to the comparison between any two towns I went ahead and left it in. ↩︎