QGIS is a free, open source geographic information system (GIS) program which can be used to visualize map data.
It can be used for some very elaborate map analysis, but for this tutorial, we’ll use it to simply display a GPX track over an OpenStreetMap map layer.
(If you don’t yet have any GPX files to view, follow one of my Recording and Extracting GPS Data to GPX tutorials.)
Table of Contents
Create a New Project
From the Project menu, select New.
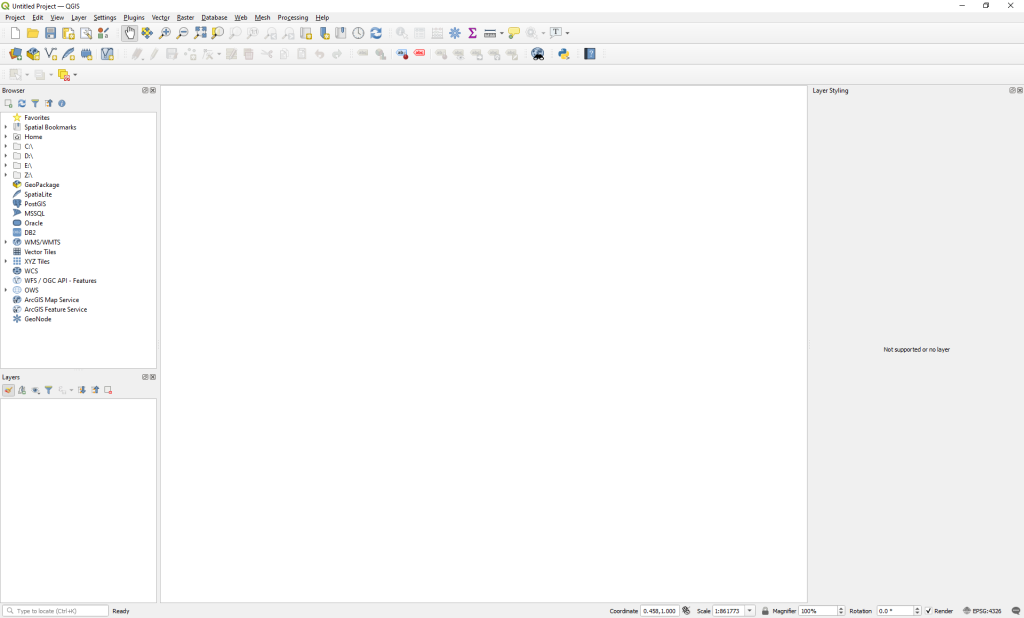
The large area in the center is where the map will show up; right now, since we haven’t added anything to it, it’s blank. The left side has a Browser for map data sources, and a map Layers box.
Add a Map Tile Layer
If you’ve used image editing software, you may be familiar with the concept of layers—two-dimensional portions of the image that stack on top of each other. QGIS uses a similar concept for maps; we’ll have a bottom layer showing a map, and then we’ll add a layer for our GPX data on top of it.
In the data Browser on the left, click the arrow next to XYZ Tiles.
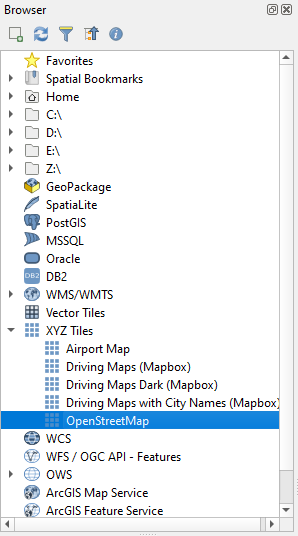
XYZ tiles are map data designed for the web. Effectively, imagine an image of a world map split up into a grid of square tiles, with each tile having an X, Y coordinate. Now imagine you have multiple maps like this for various zoom levels—some would be very zoomed out and only show broad, country level data, and some would be very zoomed in. When you create a map, you could convert your latitude, longitude, and zoom into X, Y, and Z(oom), and request only the tiles you need to create your map image.
There are many sources for XYZ tiles, not all of them free, but QGIS includes OpenStreetMap tiles for free. Drag OpenStreetMap down to the Layers area, and you should see a world map show up in the main window.
Add a GPX Data Layer
As a collection of points and lines, GPX is a vector data format, so we need to add a vector layer to our map to show it. From the Layer menu at the top of the screen, select Data Source Manager. If it’s not already selected, click the Vector tab on the left side of the screen.
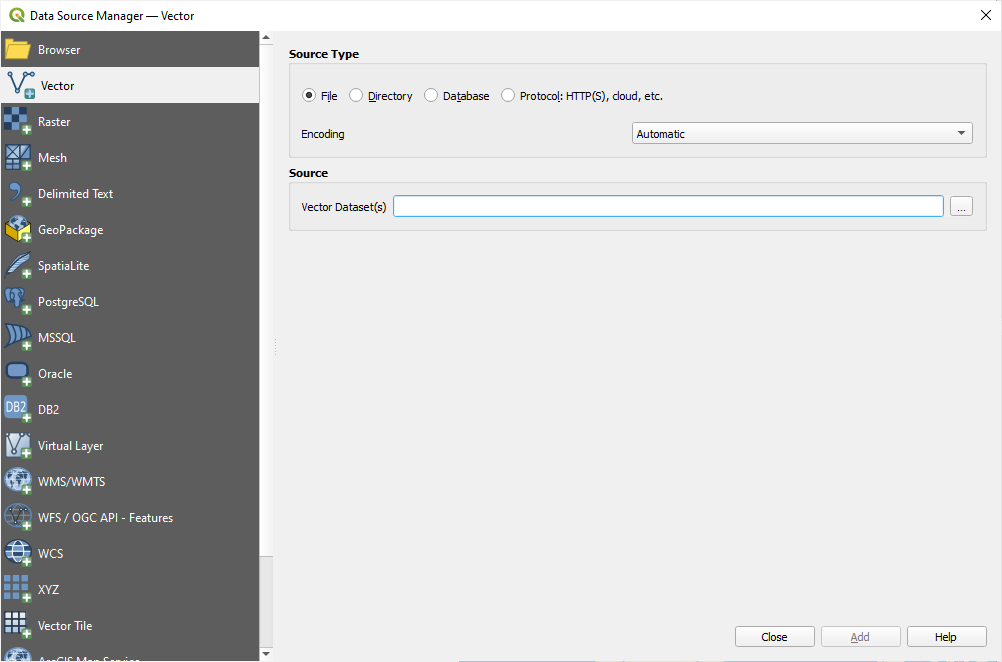
Click the ellipsis (…) next to Vector Dataset(s), and browse to your GPX file.
Select your file with the file browser, then click Add at the bottom of the Data Source Manager window. A dialog will pop up asking which Vector Layers we want to add to the project:
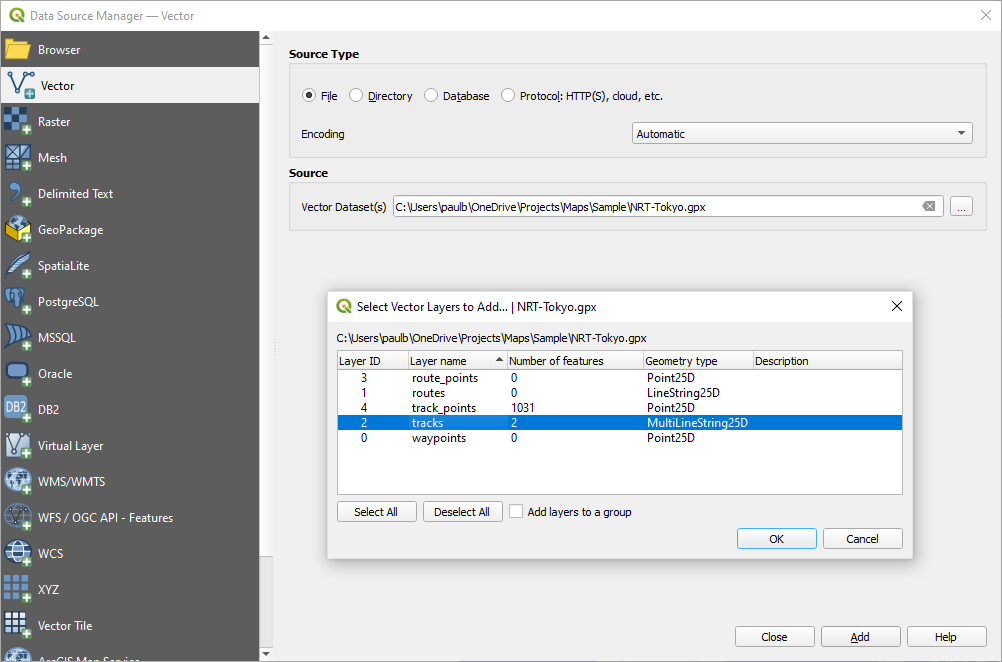
As discussed in other tutorials, GPX files can have tracks, planned routes, and waypoints. Additionally, although tracks and routes are both a set of lines connecting consecutive points, QGIS allows the option to import either as just the points (track_points and route_points).
Since we want to map a track of GPS history, select tracks in this dialog to import the tracks. Click OK, then click Close on the Data Source Manager window.
You’ll see a tracks layer in your Layers list. Your tracks should now show up on the map, though you may have to pan and zoom the map to locate them.
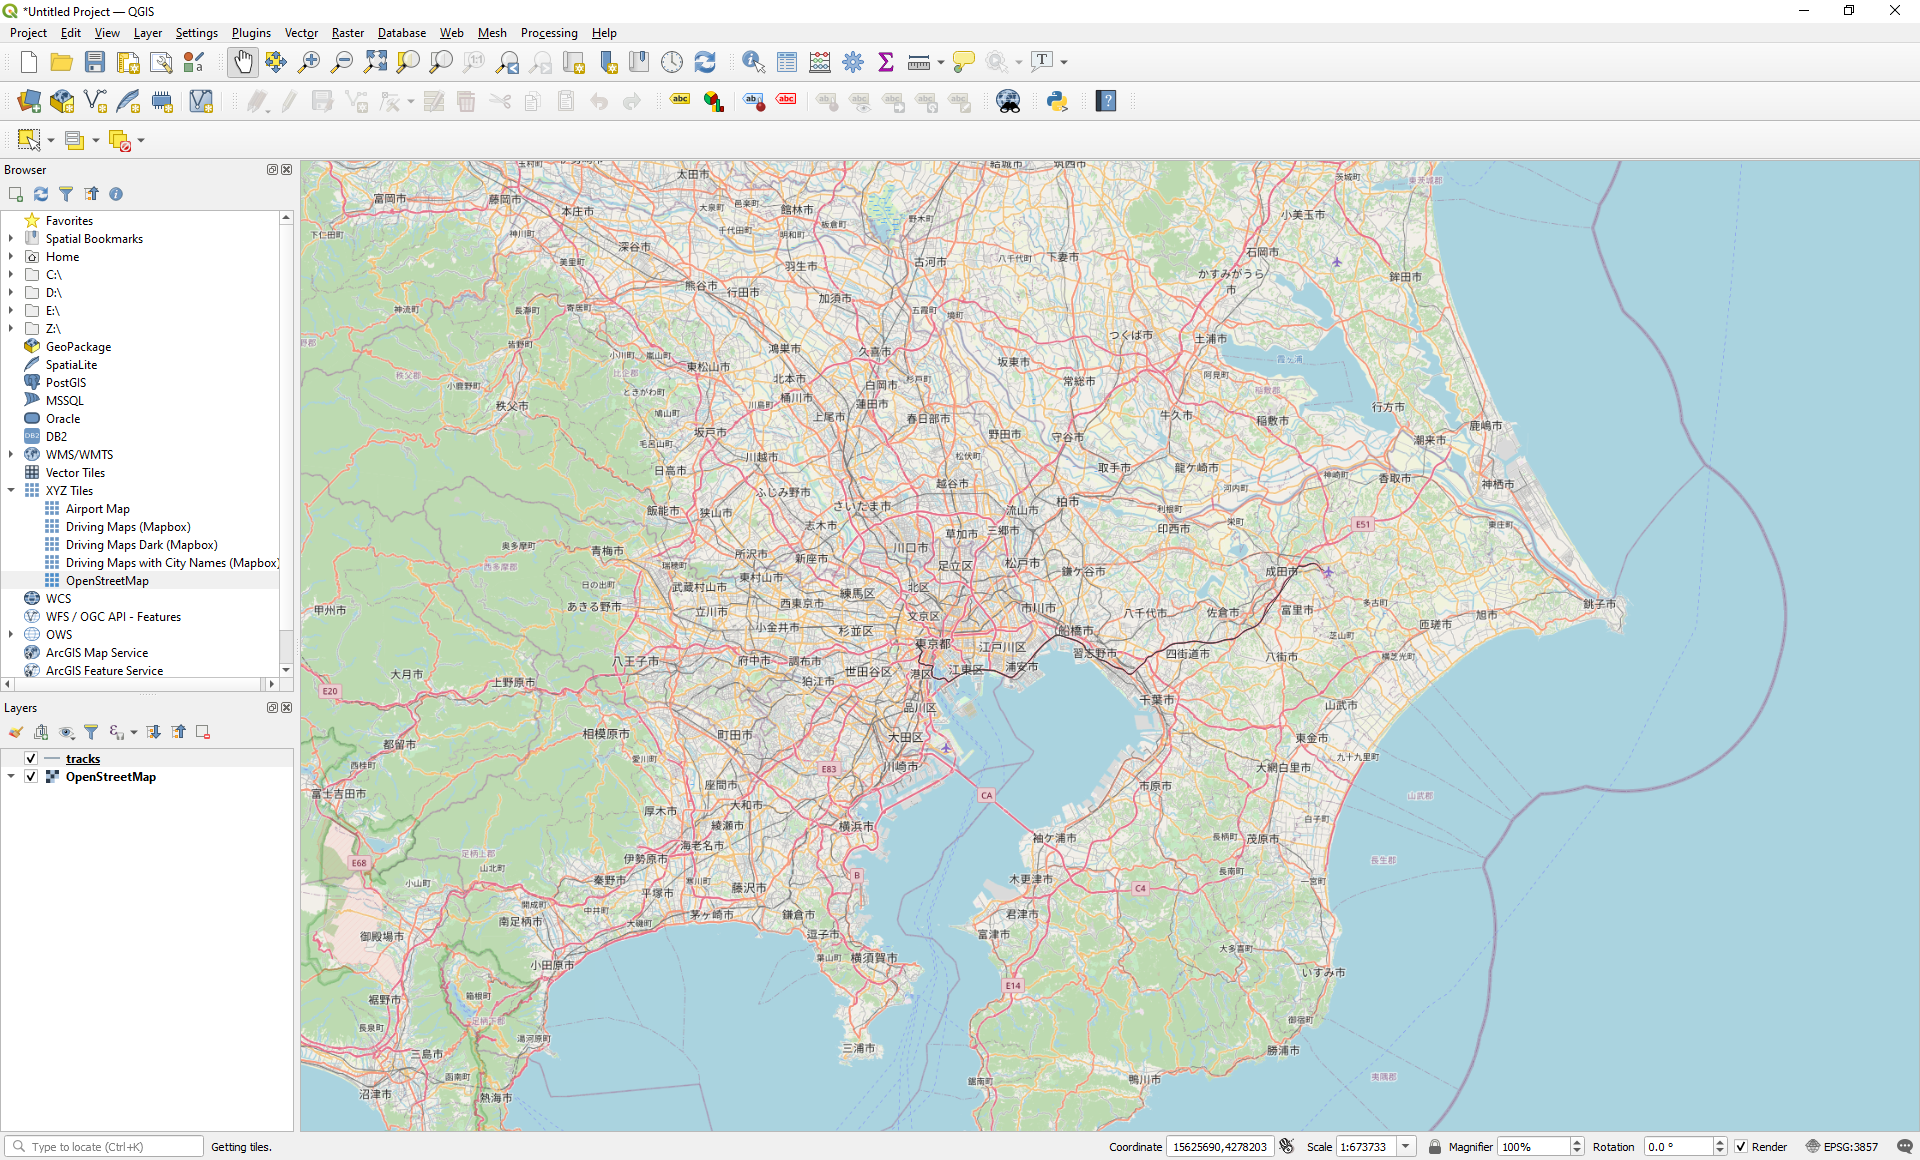
Map tiles © OpenStreetMap contributors
The track is a bit difficult to see against the map, though, so let’s style it to be more visible.
Styling Tracks
Click on your tracks layer in the Layer panel to select it. Then, from the View menu, select Panels > Layer Styling. You’ll see some styling options pop up on the right side of the screen.
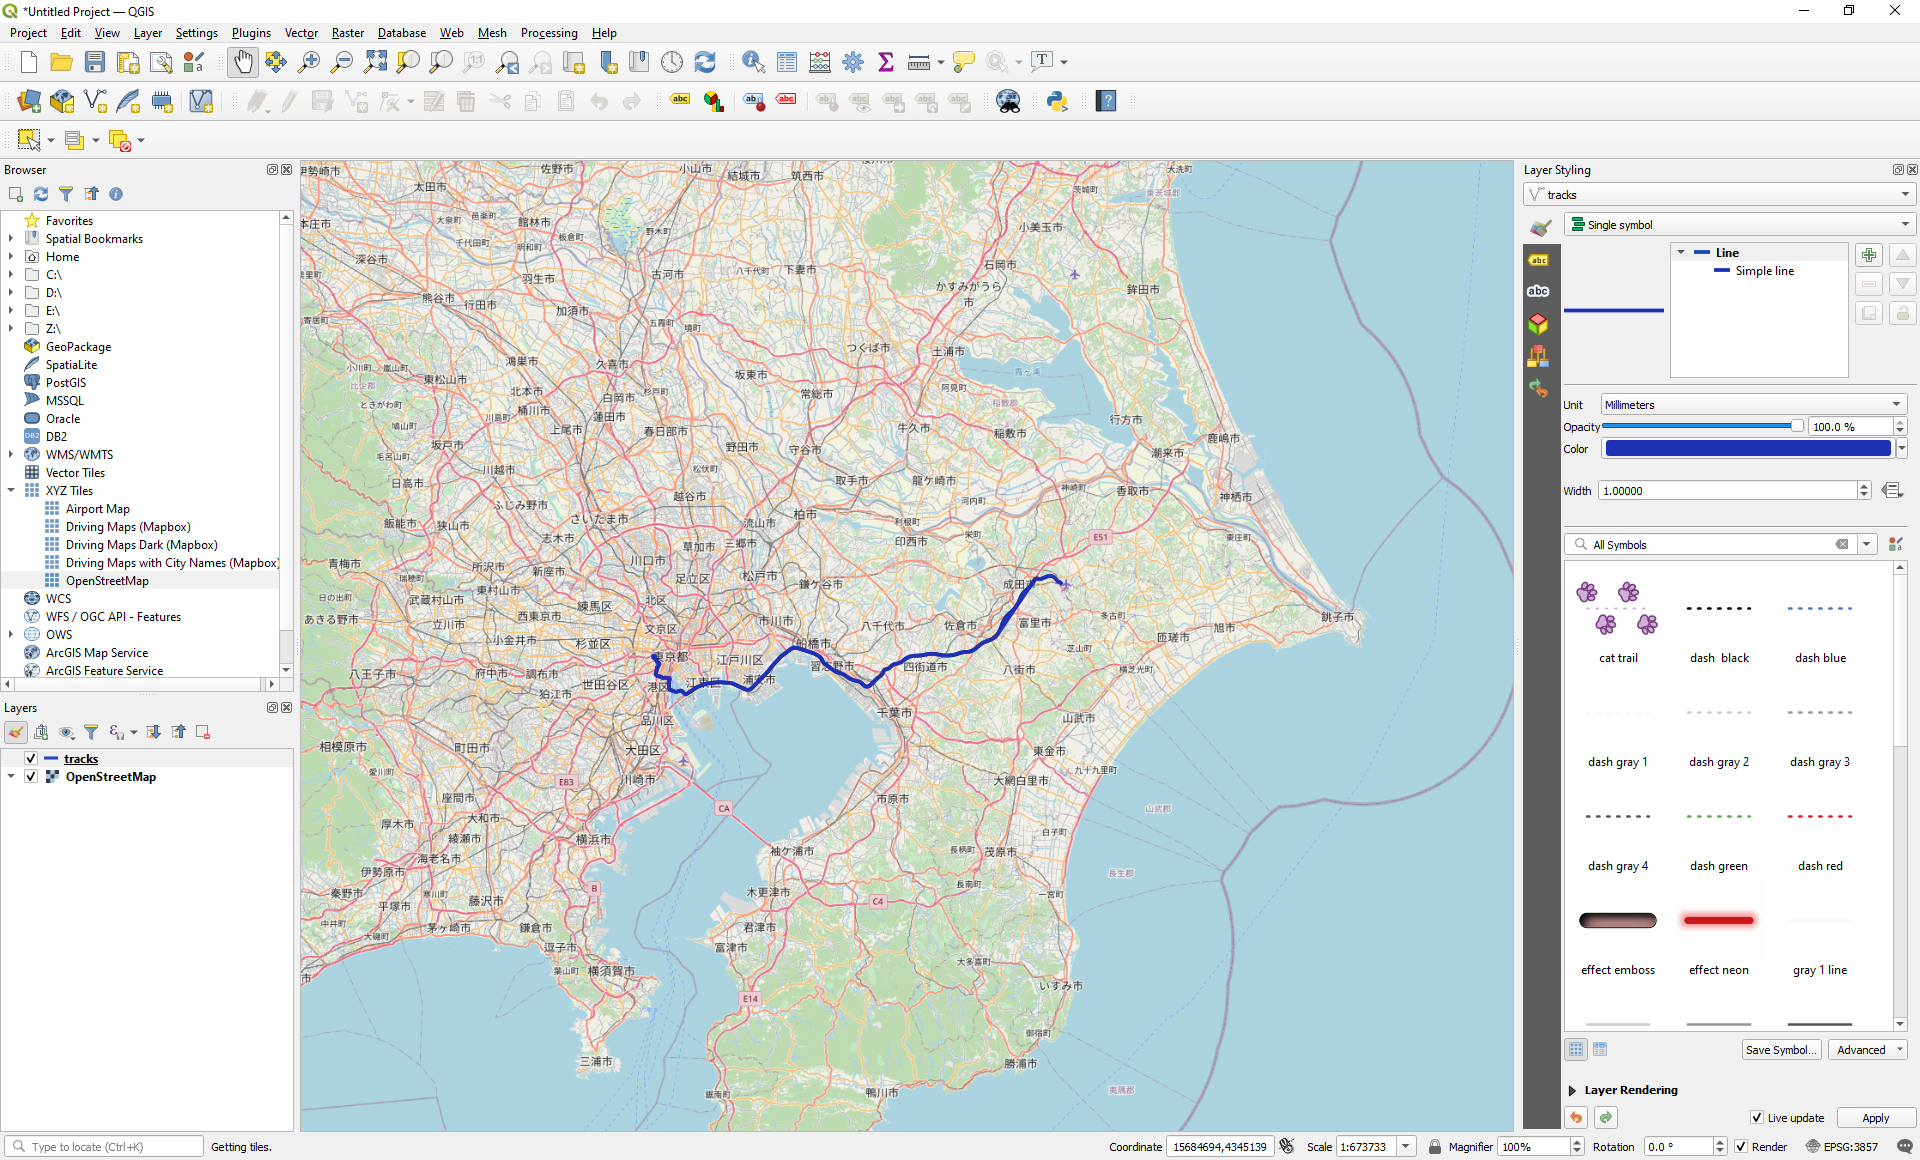
Map tiles © OpenStreetMap contributors
To make the track more visible, you can change the color and line width (I selected a dark blue, and changed the line width to 1.00000 mm.) You can also choose one of the preset styles if you prefer.
Play around with the styles to find one you like!
Exporting to an Image File
To save the currently visible map, navigate to the Project menu, and select Import/Export > Export Map to Image….
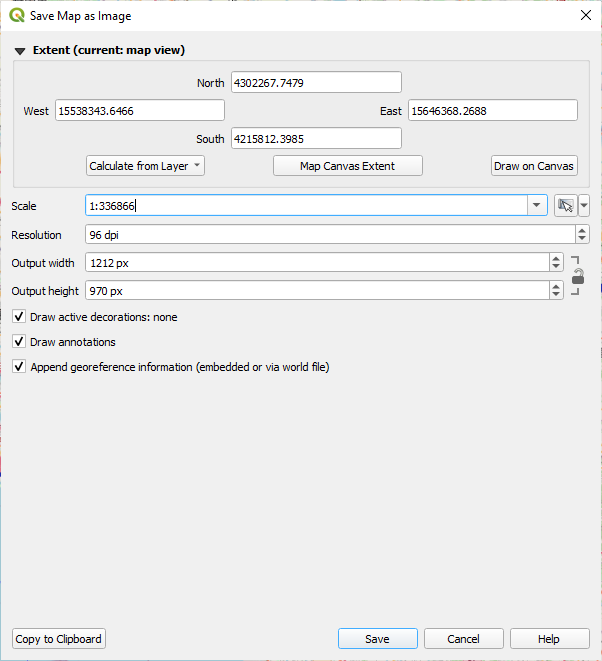
The Save Map as Image dialog will let you tweak the map settings, but if you’re happy with your current map view, just click Save and choose where to save your file.
QGIS will export the map, and you’ll now have your mapped track available as an image!
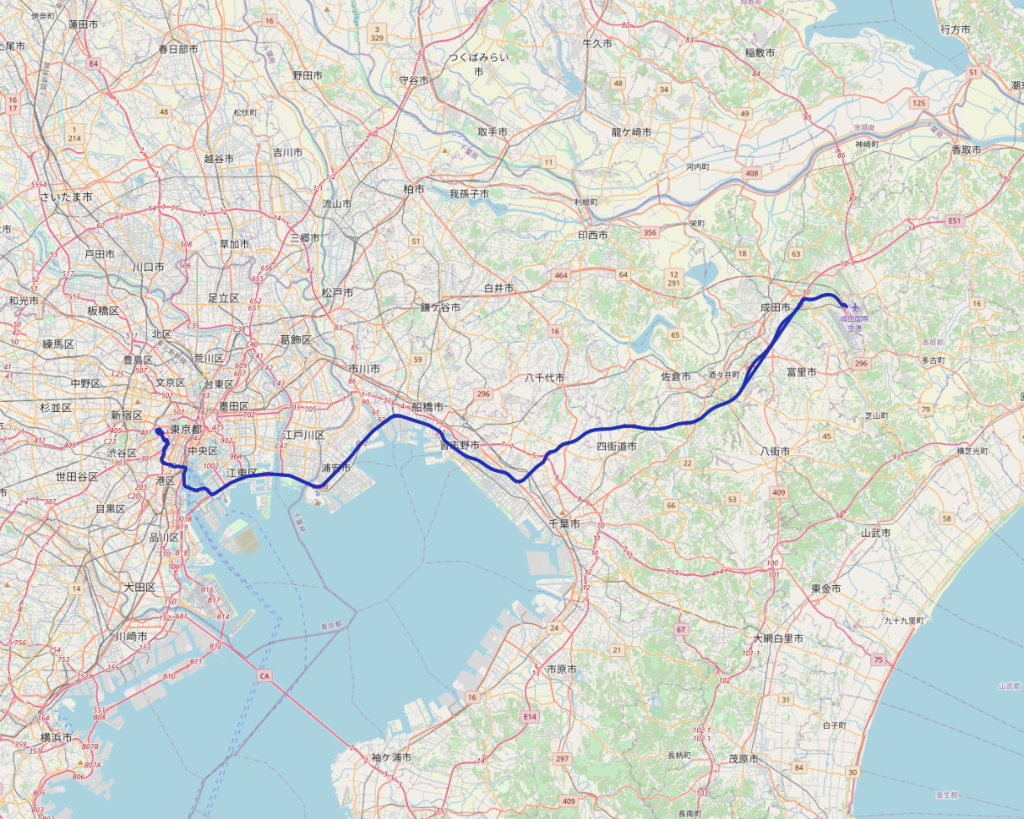
Map tiles © OpenStreetMap contributors