City Heatmaps
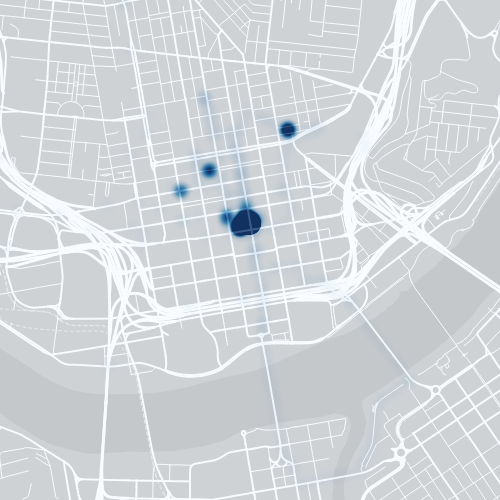
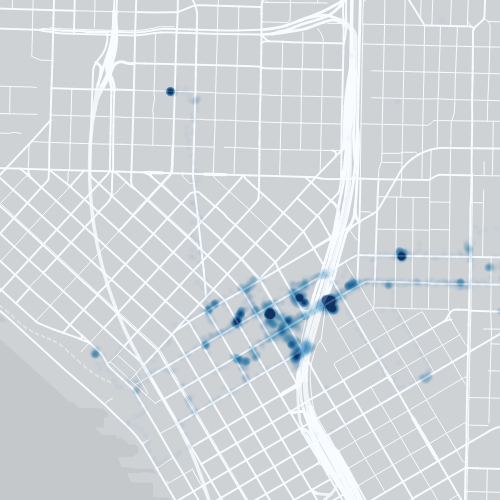
When I’m visiting cities that I can walk around in (so all of my activity is in a relatively small geographic area), I like to run a GPS logging app. I then use that data to generate heatmaps of how much time I spent in each location throughout each trip.
Gallery
Tools

I used QGIS to create all of these maps.
Data Sources
I recorded my position data using an iPhone with the myTracks app. The app was set to record a position every 60 seconds (Cincinnati) or every 30 seconds (Seattle).
Street and railroad data came from OpenStreetMap exports.
Water body data came from the USGS National Hydrography Dataset. Using The National Map Download client, I searched under Hydrography for National Hydrography Dataset (NHD) HU-8 Subbasin shapefiles for the relevant map area.