I started frequent travel in 2009, and I started noticing that quite a few of my long-distance trips seemed to be in February. I was curious what day of the year I averaged the furthest distance from home, so I created a chart from my hotel data for the last twelve years (2009–2020).
The day of the year I’ve been furthest from home on average is February 12th.

Days with the Longest Average Distance
As I expected, my furthest travel days were all in mid-February. I had a secondary peak in late August/early September (peaking on August 31st), largely because I frequently end up in the Seattle area that time of the year.
| Rank | Day of Year | Average Distance from Home | |
|---|---|---|---|
| #1 | 12 February | 2 628 mi | 4 229 km |
| #2 | 13 February | 2 611 mi | 4 202 km |
| #3 | 11 February | 2 178 mi | 3 505 km |
| #4 | 14 February | 2 124 mi | 3 419 km |
| #5 | 31 August | 1 380 mi | 2 220 km |
Where I’ve Been on February 12th

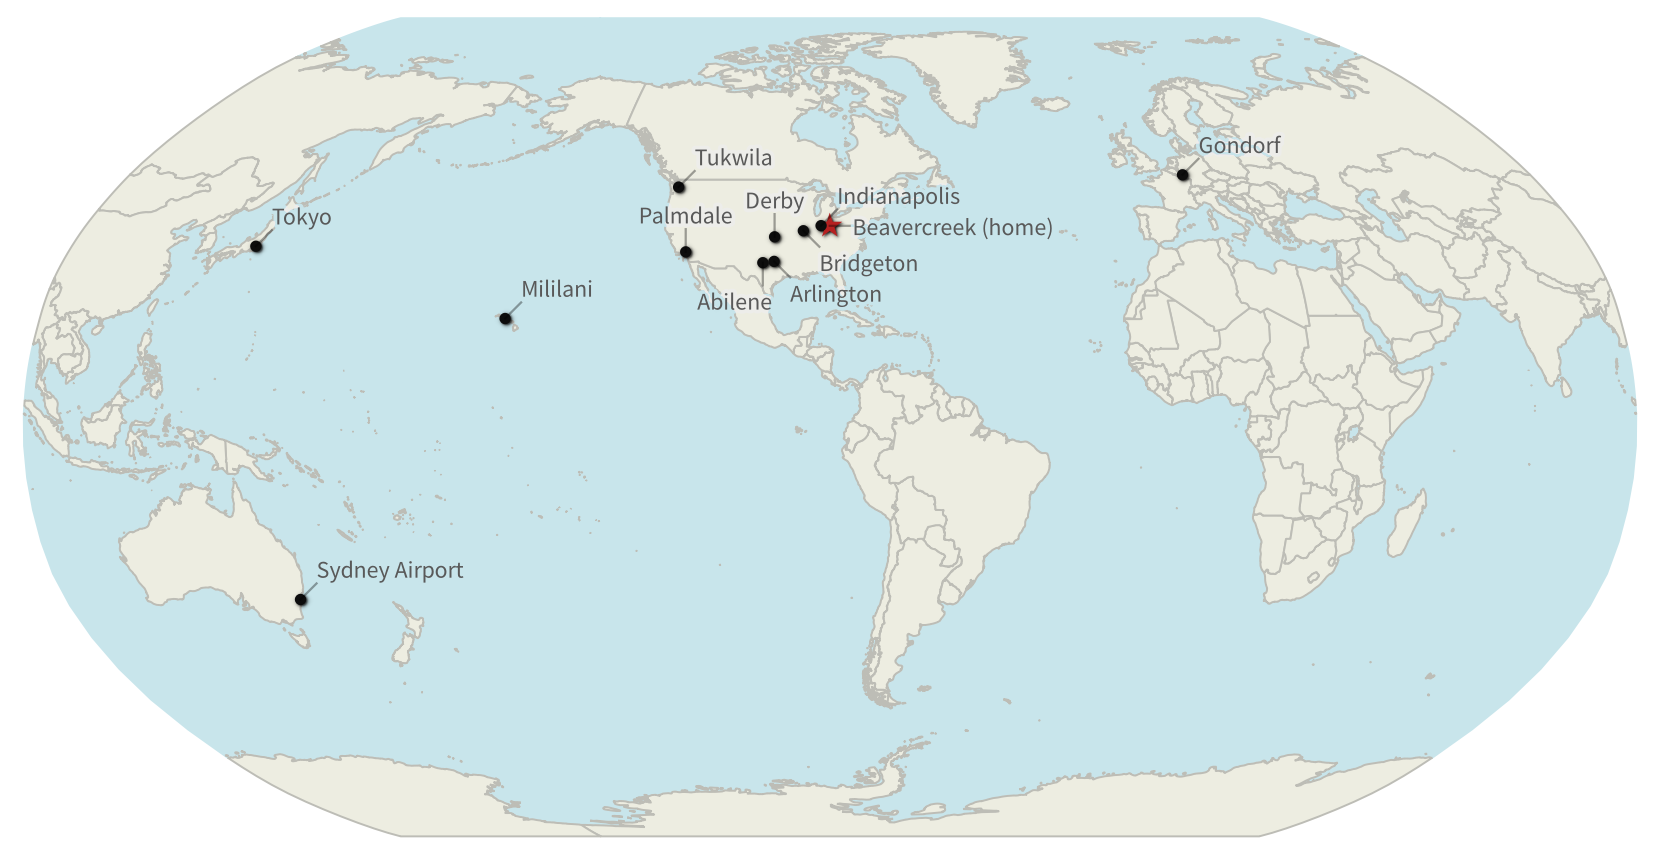
Places I’ve been on 12 February 2009–2020.
For eleven of the past twelve years, I woke up away from home:
| Date | Location | Distance from Home | |
|---|---|---|---|
| 12 Feb 2009 | Arlington, Texas United States |
874 mi | 1 406 km |
| 12 Feb 2010 | Gondorf Germany |
4 220 mi | 6 792 km |
| 12 Feb 2011 | Beavercreek, Ohio United States 🏠 |
– | – |
| 12 Feb 2012 | Mililani, Hawaii United States |
4 452 mi | 7 165 km |
| 12 Feb 2013 | Abilene, Texas United States |
1 008 mi | 1 622 km |
| 12 Feb 2014 | Bridgeton, Missouri United States |
347 mi | 558 km |
| 12 Feb 2015 | Tukwila, Washington United States |
1 964 mi | 3 160 km |
| 12 Feb 2016 | Derby, Kansas United States |
727 mi | 1 170 km |
| 12 Feb 2017 | Indianapolis, Indiana United States |
111 mi | 179 km |
| 12 Feb 2018 | Sydney Airport (SYD) Australia |
9 404 mi | 15 135 km |
| 12 Feb 2019 | Tokyo Japan |
6 529 mi | 10 507 km |
| 12 Feb 2020 | Palmdale, California United States |
1 896 mi | 3 051 km |
Days I Never Left Home
In the last twelve years, there are six days of the year I’ve never woken up away from home:
- January 16
- April 19
- June 1
- October 4
- October 15
- December 25
Technical Details
I created the chart from an Excel spreadsheet of my hotel history, using my Python hotel-data-utils. I used Python’s pandas library to process the data and the Matplotlib library to generate the chart itself. I created the map with QGIS.

