My travel logging seems to follow a pattern—start tracking something with basic tools, and eventually convert it to some sort of database. I started my flight log with spreadsheets, and ended up building a whole flight database website. My driving data started out as a folder of KMZ files, which became a single KMZ file, which became a GeoPackage SQLite database.
It’s not surprising, then, that my lodging log would go through the same process.
Table of Contents
Need for Change
What lodging data I’ve tracked and where I’ve stored it has evolved over the last decade:

Where I’ve stored lodging data
By the beginning of this year, I was storing lodging data in three locations:
- An Excel document, with four sheets:
- Stays (check out date, nights, property name, etc.)
- Cities (city names and coordinates)
- Metros (metro area names and coordinates)
- U.S. States (state names and coordinates)
- A GeoPackage file with a table of lodging locations (property name, point geometry)
- A TOML config file containing my home city
I mostly use my lodging data to generate my Year in Travel posts, using Python scripts I wrote to compile the data. However, these scripts resided in multiple places:
- My Lodging Data Utilities repository
- A local script within my Year in Travel project folder which read from the Excel file directly
To reduce complexity and improve maintainability, I wanted to consolidate all of my lodging data into a single file, accessed through a single consistent script library.
GeoPackage Implementation
I already had a GeoPackage file holding some of my lodging data. GeoPackages are effectively SQLite databases that are set up in a specific way to hold geospatial data, and can support multiple tables (layers) of data within a single file. They work well with QGIS, which I use to edit maps. I’ve already successfully used GeoPackages to consolidate other travel data. Given all that, it was an easy decision to merge the rest of my lodging data into my existing lodging locations GeoPackage.
While redesigning the data architecture, I decided to make some minor changes to data I collected. Instead of explicitly tracking U.S. states, I decided to broaden that data to regions, so that other countries with well-known subdivisions (such as Canadian provinces or Australian states) could also be tracked. My distance from home by day script was only storing my current hometown for calculations, but I instead decided to make a table of homes with dates so I could run the script on older data as well.
My lodging data is relational:
- Each stay and home have exactly one location
- Most locations have one city (some edge cases involving overnight flights have no city)
- Cities have zero or one metro areas, and zero or one regions.

GeoPackage Entity Relationship Diagram
Each GeoPackage layer can have a single geometry type (such as points, lines, or polygons) or no geometry. Since stays and homes both reference the locations table, I opted to have them have no geometry (only data), since their location could be derived from table joins. For each of the remaining four tables (stay_locations, cities, metros, and regions), I decided on using point (latitude and longitude) geometry. While the latter three could have also been represented by polygons, in reality, I was treating them like a single representative point (calculating distance to them or putting a marker on a map), so I opted to keep them as points. For each of these tables, I created a key column in a standardized format; if I need to show polygons at some point in the future, I can use that in QGIS to join them to polygon layers.
The detailed data structure is shown in my GitHub documentation.
QGIS Configuration
Managing relational data can sometimes be cumbersome, requiring looking up feature ID (fid) numbers in one table to place in a join column of another table. Fortunately, QGIS provides UI options for this to show the joined table and let you select an appropriate feature from a dropdown menu.
First, I created an id_str virtual field for each of the join target layers (stay_locations, cities, metros, and regions), which will be used as the text of the dropdown. To do this, I opened Layer Properties for each of these layers, and selected the Fields icon on the left, bringing me to the Fields screen:
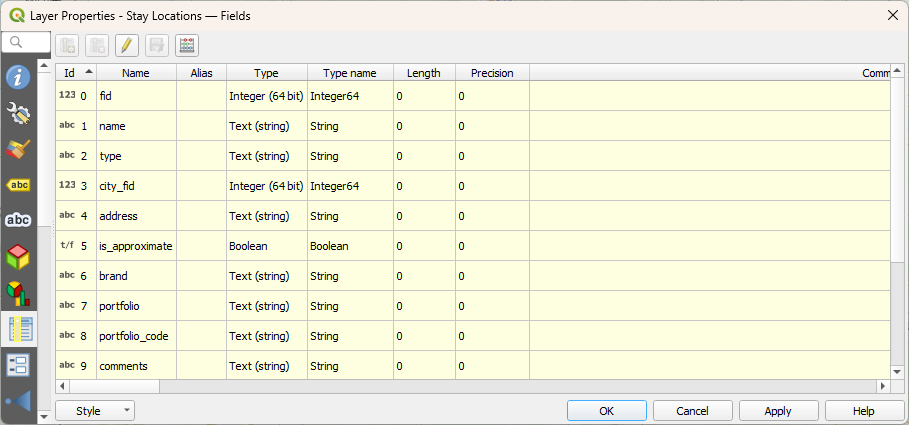
Fields
At the top, there’s a button with an abacus icon named Field Calculator. Selecting it brought me to the Field Calculator screen, allowing me to create a virtual field—a field that’s not stored in the GeoPackage, but instead is calculated as needed. I used it to create a QGIS expression for a good string label for the feature:
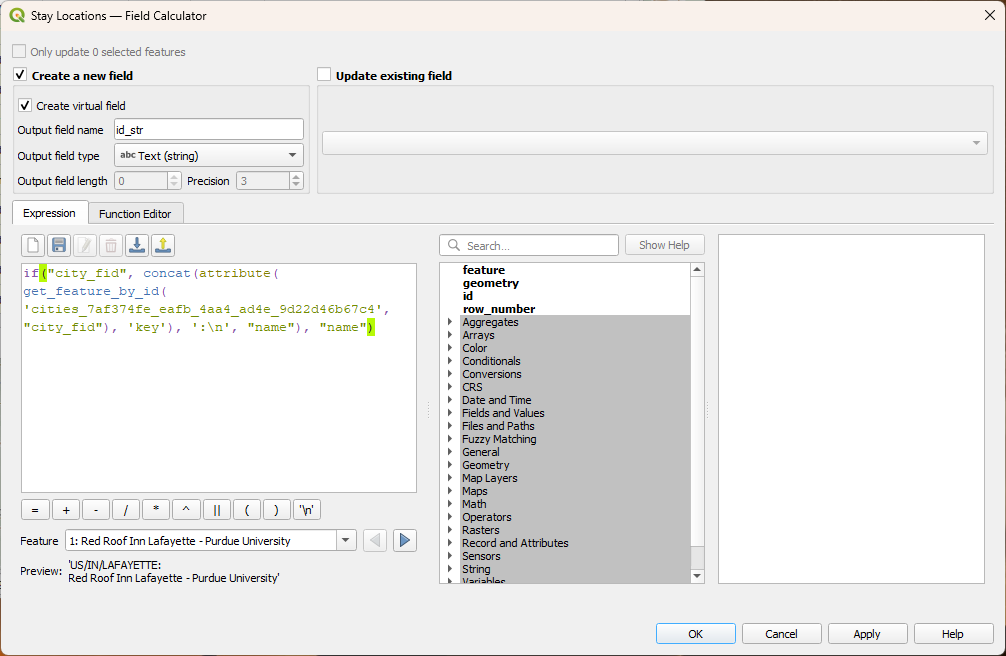
Field Calculator
I ensured the checkboxes to create a new field and create a virtual field were checked, named it id_str, and set the type to Text (string). I used the following expressions for each of the four join targets:
| Layer | id_str expression |
|---|---|
| stay_locations | if("city_fid", concat(attribute(get_feature_by_id('CITIES_LAYER', "city_fid"), 'key'), ':\n', "name"), "name") (The CITIES_LAYER layer can be added by opening the Map Layers line in the center panel, and double clicking the name of the cities layer.) |
| cities | (No id_str necessary, since the city’s key field already was a good ID string) |
| metros | concat("key", ':\n', if("title", "title", "name")) |
| regions | concat("iso_3166_2", ':\n', "name") |
Once those were all set up, I went to each of the join source layers (stays, homes, stay_locations, and cities), opened Layer Properties, and selected Attributes Form from the left menu:
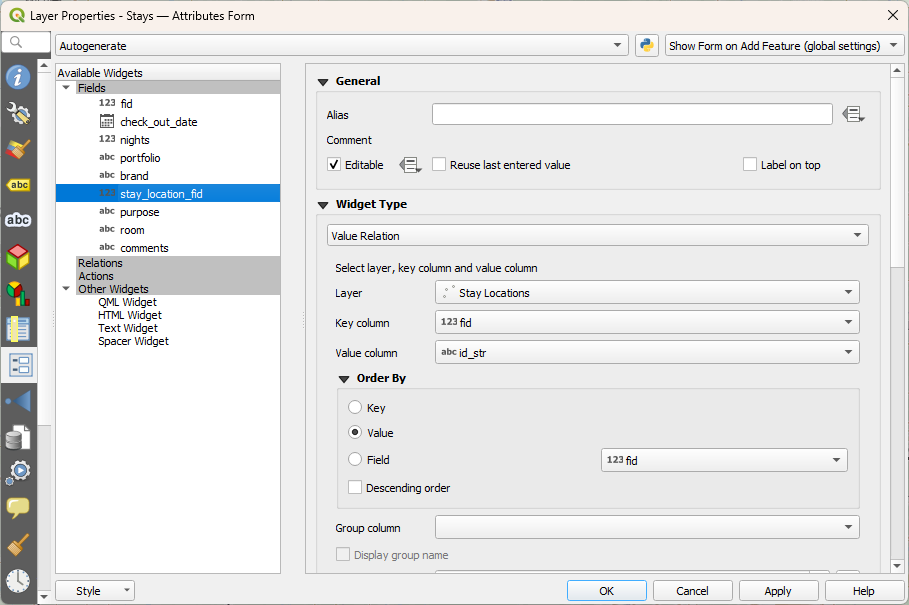
Attributes Form
For each of the _fid join columns, I changed the Widget Type to Value Relation, selected the appropriate join Layer, set the key column to fid, and the value column to id_str. (In the case of joining to the cities layer, I set the value column to key.) Finally, I made sure to order by Value.
Now, when I create a new feature, I don’t have to look up any feature IDs. Instead, I select the joined feature from a dropdown menu, and the correct fid is stored in the GeoPackage.
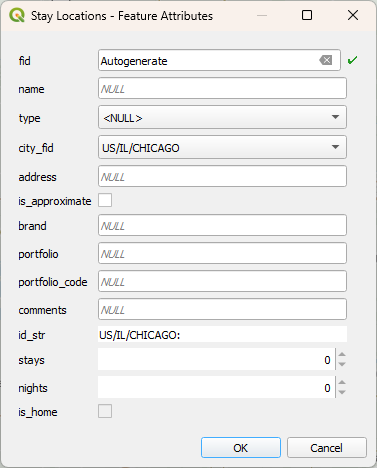
In this case, the city_fid field shows a dropdown to select a feature.
Python Script Updates
Since my lodging data has included more than hotels for a while, I took the opportunity to rename my lodging script GitHub repository from hotel-data-utils to lodging_data_utils.
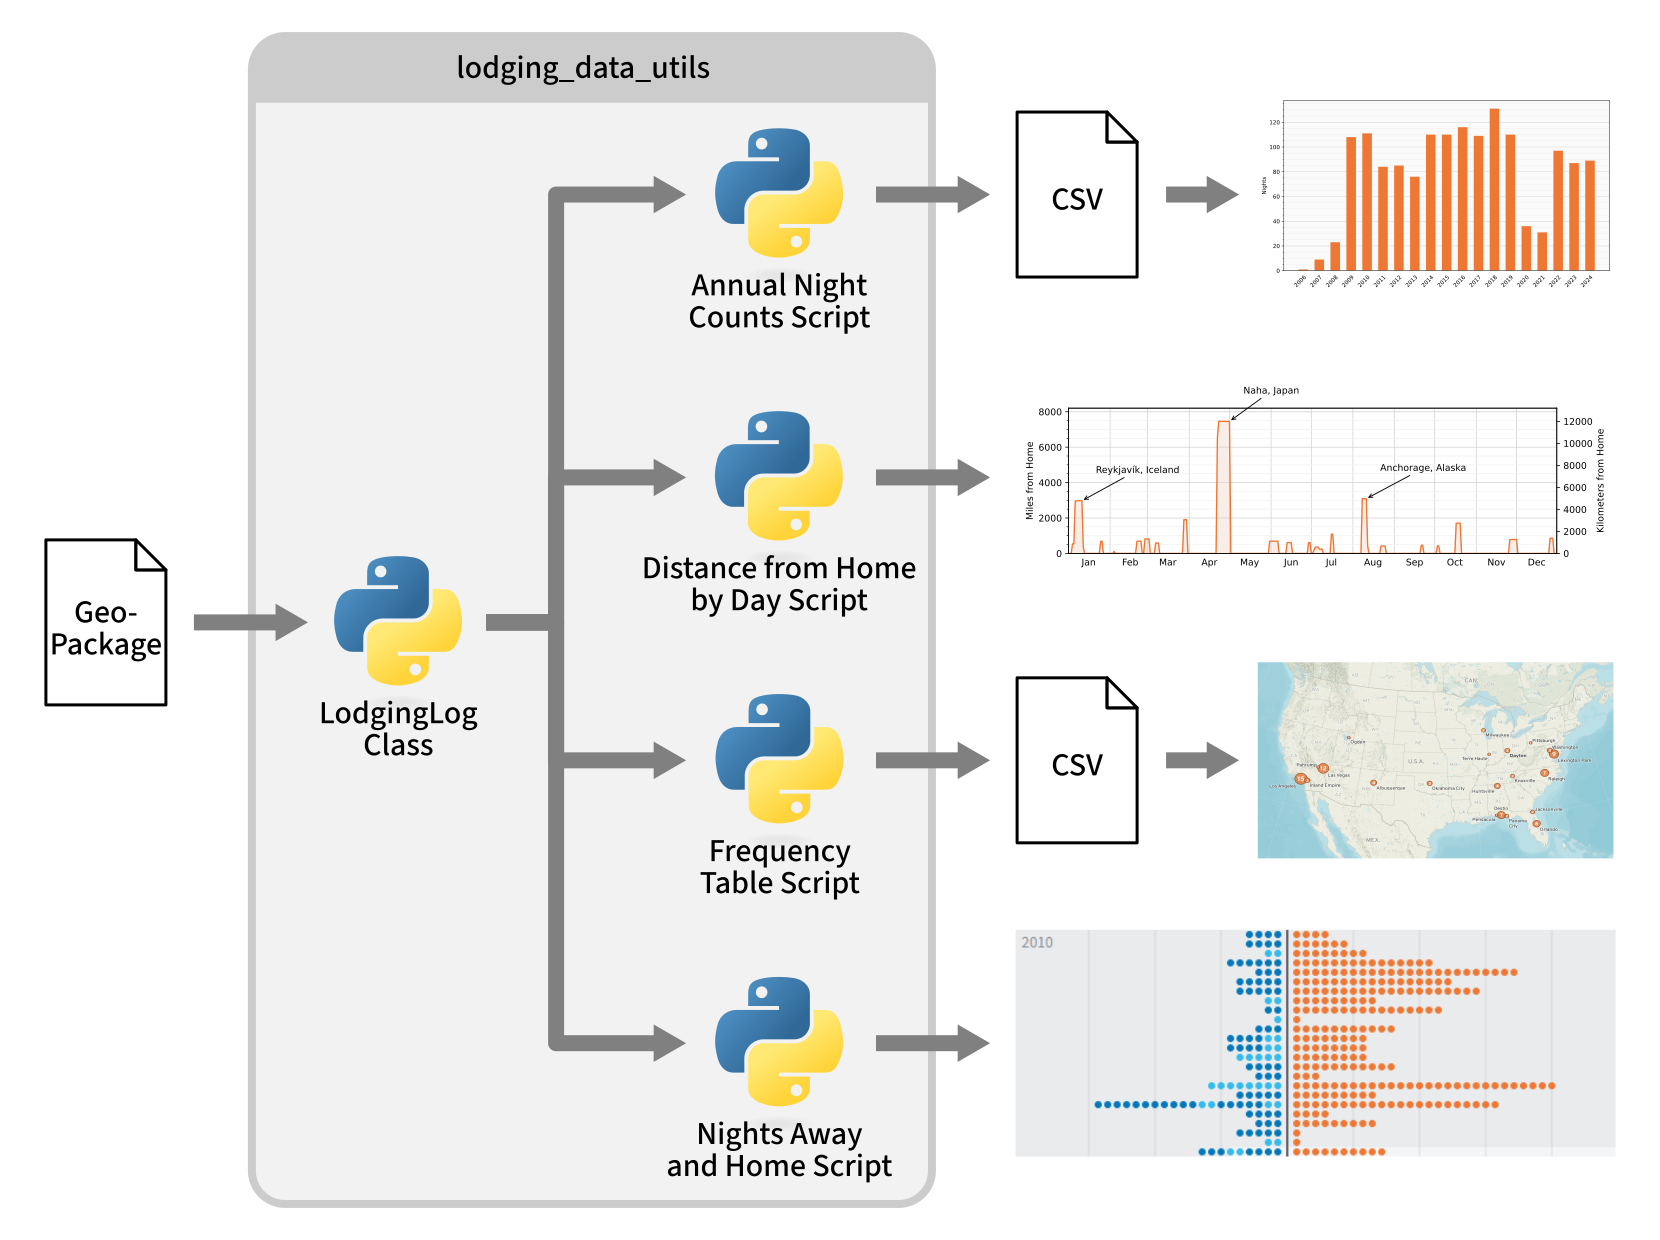
My updated script setup
I created an updated LodgingLog class, which all my other scripts use to interact with the GeoPackage file. This should make things easier if I need to update the GeoPackage data structure in the future—I should be able to update only this class rather than every script.
Previously, one of my Year in Travel scripts directly interacted with the Excel stays data to generate a chart of hotel night counts by year. I decided to pull this into lodging_data_utils as a new Annual Night Counts script. This script gets lodging data via the LodgingLog class and outputs a CSV file of years and night counts, which my Year in Travel project can then use to generate a chart.
My Distance from Home by Day script required only minor updates to work with the new LodgingLog class. However, I did take the opportunity to fix some Matplotlib warnings.
My Frequency Table script needed a bit more work. It had previously handled a lot of the mapping cities to metros on its own when grouping by metro, but I decided instead to delegate that grouping by various levels to the LodgingLog class. I also changed it from having an option to group by U.S. state to grouping by region (which still includes U.S. states, but allows subdivisions in other countries as well). Finally, I got rid of the ability to group by historic metro (e.g. the metro area a stay was in at the time of the stay, versus the metro area the stay location is currently in). It simplified my data structure to not have to associate a metro with each stay, it wasn’t functionality I was using, and if I ever do need it, I can use the latitude and longitude of each stay location to derive it again.
Nights Away and Home also needed some overhaul; it used a lot of custom classes that I’d thought I’d use for other lodging scripts but never did. These classes didn’t work well with the new LodgingLog class, so I took the opportunity to rewrite the script to make it function more like the other scripts.
Results
These changes resulted in a more cohesive lodging log system architecture: a single source of truth, clear data relationships, and a single repository of scripts to manage it. This should make entering and managing my lodging data much easier, and should make it easier to create the maps and charts for my annual Year in Travel posts.