I started my travel-heavy position at my job in 2009, so the 2010s were the first decade where I really frequently traveled throughout the decade.
Since then, I started tracking my flights in a spreadsheet, then eventually wrote an entire flight logging database website. I learned how to extract history from GPS navigation devices and started logging my driving. I also started tracking hotel stays and a myriad of other travel activities as well.
As a result, I have quite a lot of data built up on my travels over the last decade. For the past seven years, I’ve put together annual end-of-year travel summaries. With the turning of the decade, it seemed to be a good time to make myself a decade travel summary. While there’s a small overlap between the decade and annual summaries, I’ve generally tried to focus the decade summary more on areas that make more sense on a 10-year scale, so even readers of my previous summaries should see some new statistics!
Table of Contents
In the Air
From 2010 through 2019, I flew on 824 flights, with a total distance of 555 874 miles (894 590 km).
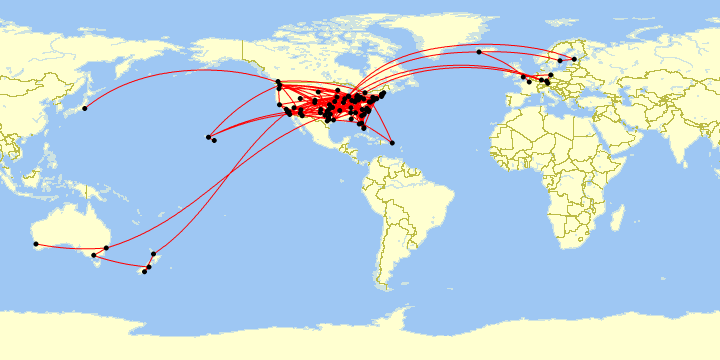
Flights (2010–2019)
Map generated by Paul Bogard using the Great Circle Mapper - copyright © Karl L. Swartz
My first international trip of the decade was a business trip to Germany in February 2010, and I finished my international travel with a Nordic vacation in August 2019. In between, I picked another multi-country Europe trip, as well as travel to Canada, Australia, New Zealand, and Japan.
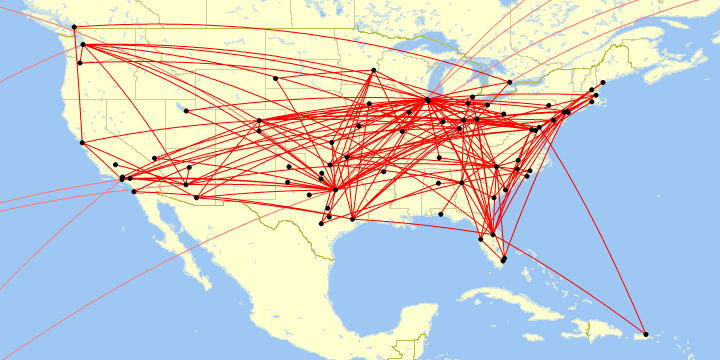
Flights (North America, 2010–2019)
Map generated by Paul Bogard using the Great Circle Mapper - copyright © Karl L. Swartz
Within the U.S., I’ve now been to every major hub airport, and a lot of minor airports as well.
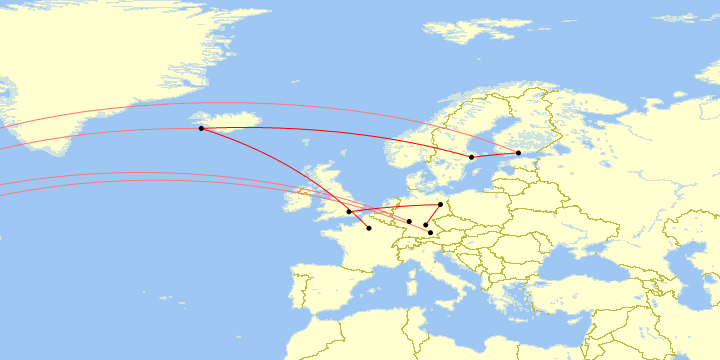
Flights (Europe, 2010–2019)
Map generated by Paul Bogard using the Great Circle Mapper - copyright © Karl L. Swartz
I somehow managed to visit four German airports (Frankfurt, Munich, Nuremberg, and Berlin Tegel) while visiting no more than one airport in any other European country.

New Airports (2010–2019)
I visited 93 airports this decade, 76 for the first time.
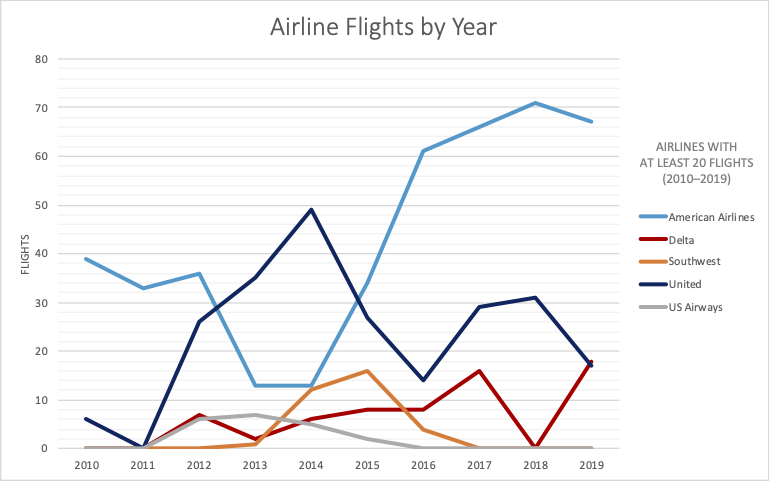
When I’m flying for work, contracts with airlines for particular routes drive which airlines I can fly, which means my most-flown airlines change year to year. I started out the decade flying mostly American, ended up primarily United in the middle of the decade, then went back to American by the end.
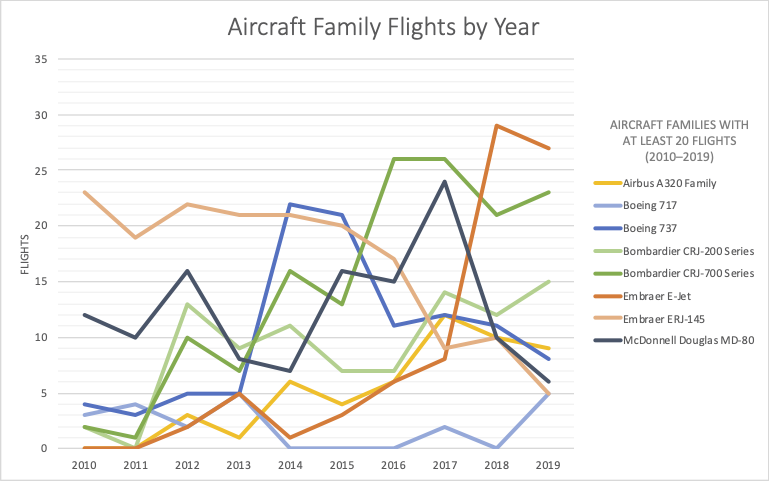
With Dayton as my primary airport, I fly on a lot of regional jets. At the start of the decade, the 50-seat ERJ-145 dominated my flights. By the end of the decade, I was mostly flying the larger 70–90 seat E-170/175/190 and CRJ-700/900 jets.

Flight graph (2010–2019). Click for full-size image.
My most traveled routes were by far Dayton to Dallas/Fort Worth or Chicago O’Hare. Dayton requires a layover for most of my trips, and most of my flights were on American or United this decade. DFW is American’s largest hub, and ORD is a large hub for both airlines.
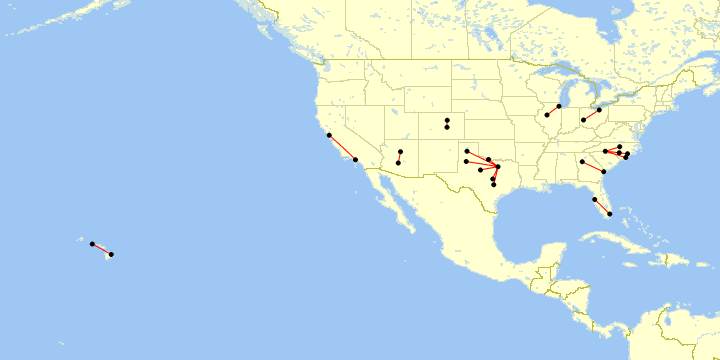
Intrastate Flights (2010–2019)
Map generated by Paul Bogard using the Great Circle Mapper - copyright © Karl L. Swartz

Intrastate Flight Graphs (2010–2019)
Not counting my two flights that returned to the same airport, I had 42 flights (18 unique routes) between pairs of airports within in a single U.S. state.
On the Ground
I drove approximately 211 182 miles (339 864 km) this decade.
| Personal Cars | 154 363 mi | 248 423 km |
| Rental Cars | 56 819 mi | 91 441 km |
| Total | 211 182 mi | 339 864 km |

Distance Driven by Year. Includes both business and personal driving.
2016 far exceeded all my other years for driving, mostly because of my summer project to visit every one of Ohio’s 88 counties.
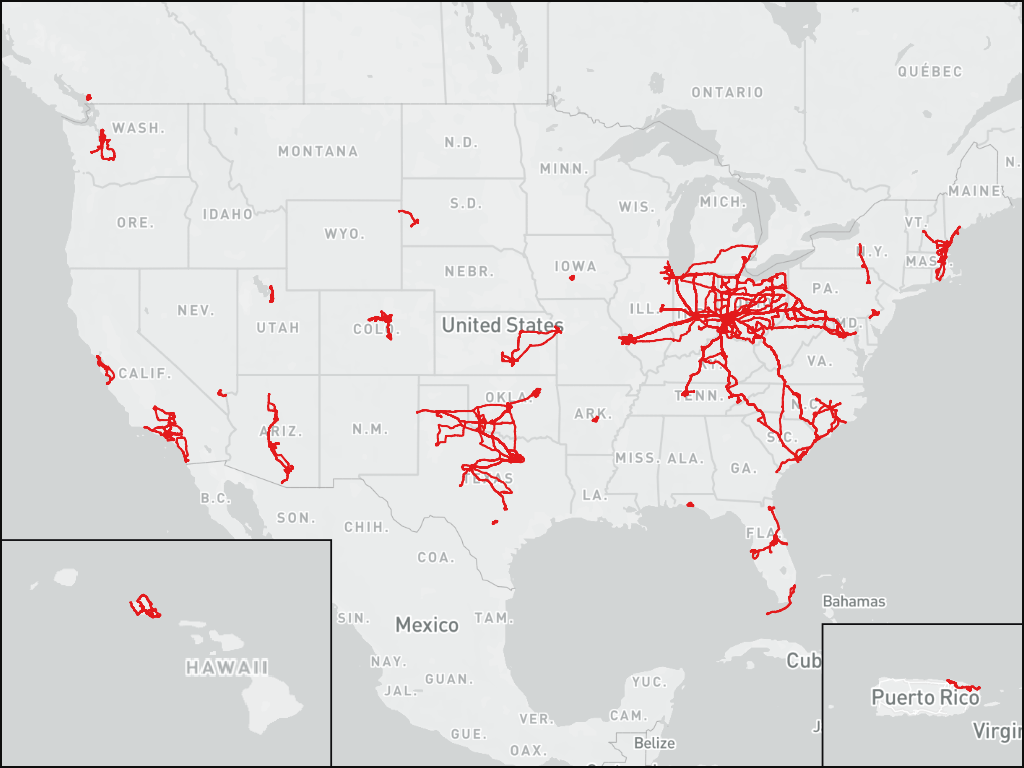
Driving (United States and Canada, 2010–2019)
Map tiles © Mapbox © OpenStreetMap (Improve this map)
My driving in the U.S. has generally connected into two large clusters, with a bunch of smaller areas. The largest cluster is based in my home state of Ohio, and it largely extends to places I’ve driven to from home, although that started to overlap a few places I’ve flown to (particularly in the Carolinas). I also have a Texas-Oklahoma cluster, since I started the decade frequently traveling to Dallas and Abilene, Texas, and ended the decade with a lot of trips to Tulsa and Altus, Oklahoma.
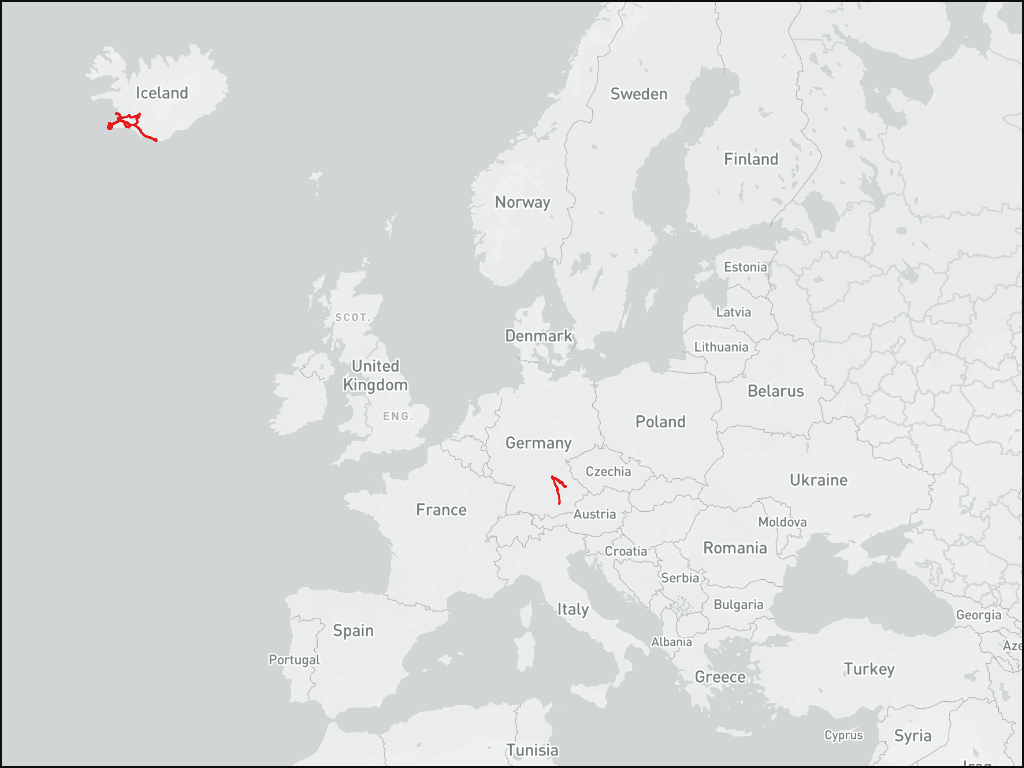
Driving (Europe, 2010–2019)
Map tiles © Mapbox © OpenStreetMap (Improve this map)
Within Europe, though I’ve been to other countries, I’ve only driven in Germany and Iceland.
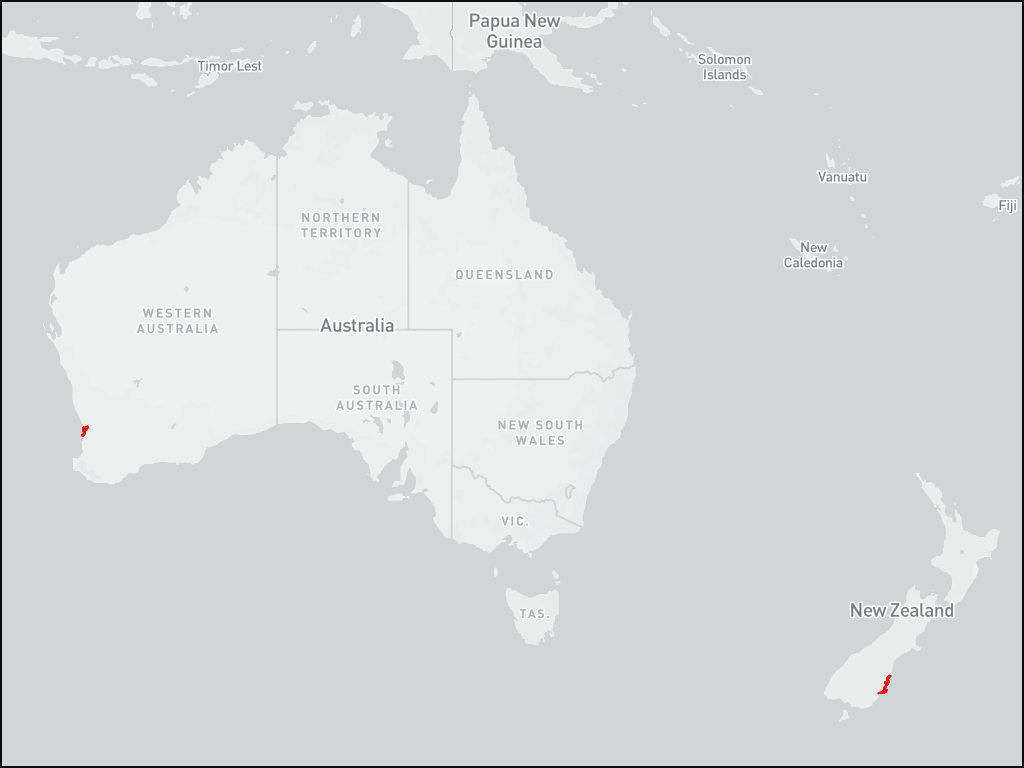
Driving (Australia and New Zealand, 2010–2019)
Map tiles © Mapbox © OpenStreetMap (Improve this map)
Likewise, I’ve visited other cities in Australia and New Zealand, but Perth and Dunedin were the only areas I drove in. Perth was my first experience driving on the left side of the road—I lived in the UK for three years as a child, but I was not old enough to drive.
Geography
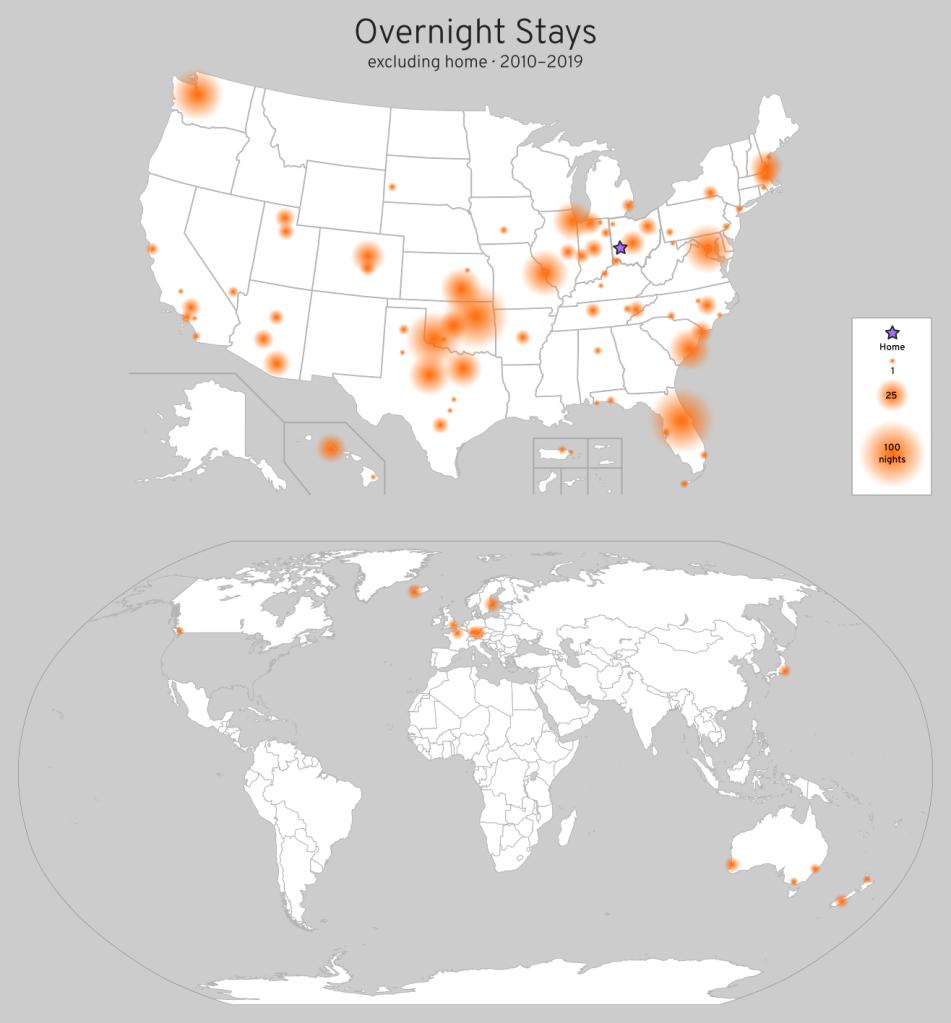
I visited a good portion of the United States and some of the world, but quite a bit of my travel was focused in Oklahoma and northern Texas.
My top 10 metro areas (excluding home) by number of nights I’ve stayed there this past decade are as follows:
| Rank | Metropolitan Area | Total Nights |
|---|---|---|
| #1 | Tulsa, Oklahoma, U.S. | 97 |
| #2 | Orlando, Florida, U.S. | 96 |
| #3 | Altus, Oklahoma, U.S. | 71 |
| #4 | Seattle, Washington, U.S. | 60 |
| #5 | Washington, D.C., U.S. | 55 |
| #6 | St. Louis, Missouri, U.S. | 50 |
| #7 | Charleston, South Carolina, U.S. | 41 |
| #8 | Abilene, Texas, U.S. | 40 |
| ⋮ | Wichita, Kansas, U.S. | 40 |
| #10 | Chicago, Illinois, U.S. | 36 |
For each year, my most visited metro area (by number of nights stayed):
| Year | Most Visited Metropolitan Area |
|---|---|
| 2010 | Washington, D.C., U.S. |
| 2011 | Washington, D.C., U.S. |
| 2012 | Charleston, South Carolina, U.S. |
| 2013 (tie) |
Charleston, South Carolina, U.S. Chicago, Illinois, U.S. Honolulu, Hawaii, U.S. |
| 2014 | Orlando, Florida, U.S. |
| 2015 | Orlando, Florida, U.S. |
| 2016 | Tulsa, Oklahoma, U.S. |
| 2017 | Tulsa, Oklahoma, U.S. |
| 2018 | Altus, Oklahoma, U.S. |
| 2019 | Wichita, Kansas, U.S. |

I visited 11 countries this past decade, 7 for the first time. (I also had a layover in Finland this year, but since I did not leave the airport, it’s not counted as a visited country on this map.) Every country in the world that I have ever visited, I also visited at some point this decade.
Trivia
My favorite airport restaurant (and the one I’ve eaten at the most) is Tortas Frontera, with three locations at Chicago O’Hare.
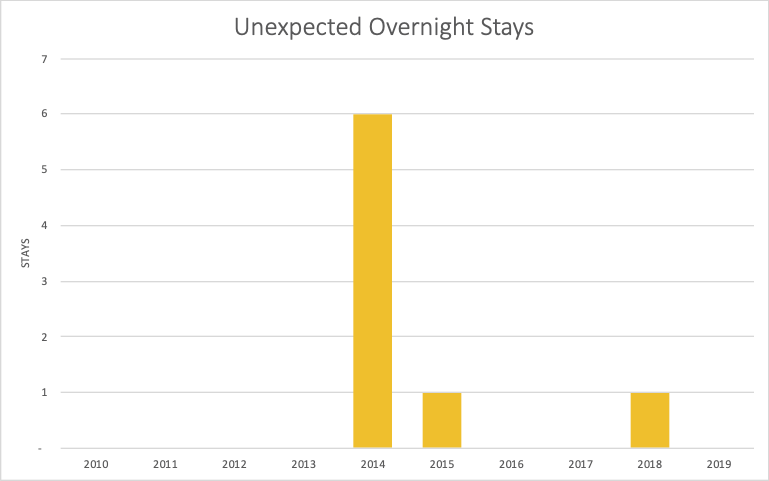
I’ve generally been pretty lucky with avoiding major travel disruptions, but 2014 was not my lucky year—I got stuck overnight six times due to weather or other flight delays and cancellations. Three times were in Chicago, one was in Newark, one was in Orlando, and one was in Charlotte.
I also got stuck overnight in Little Rock in 2015 due to a thunderstorm. In 2018, a series of weather and mechanical delays caused me to miss my connection at DFW and spend the night in Dallas.
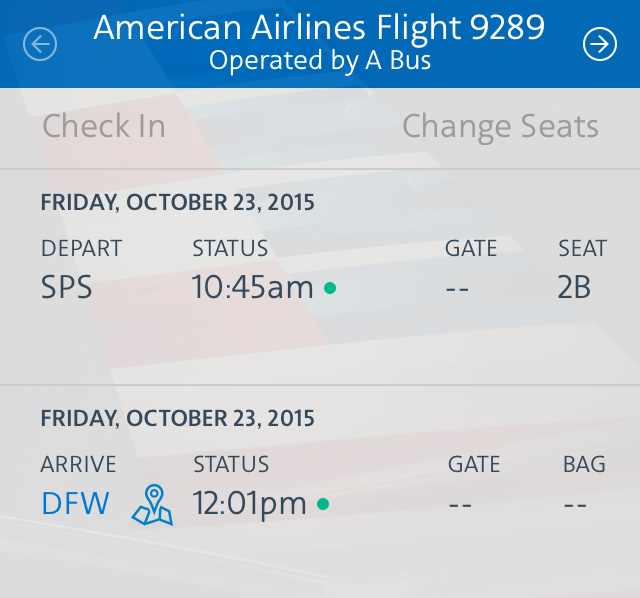
In 2015, I had a flight from Wichita Falls to Dallas/Fort Worth, Texas which was cancelled, but the flight was a short enough distance that the airline had a taxi company transport us on a fleet of 10-passenger vans. I even received a boarding pass for that “flight.”